Ticker 1

Ticker 2

Click "Like" to Receive First Hand Updates From The Analysis Site / Click "SHARE" to share

Wednesday, 28 February 2018

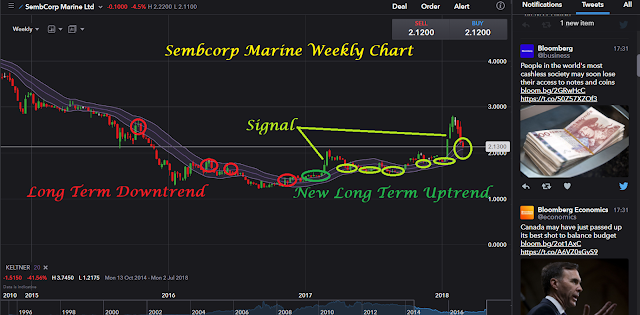
Sembcorp Marine: 28 February 2018, Wednesday, 5.50pm Singapore Time

Sembcorp Marine: 
28 February 2018, Wednesday, 5.50pm Singapore Time
(Click on Technical Chart Above to Expand)

Attached is the Technicals for Sembcorp Marine. It shows how the stock slowly transited from long term downtrend to new long term uptrend.
I have gotten the majority of my Sembcorp Marine at $2.15 now. Most of my averaged buys are around this price in aggregation. Today it ended at $2.12. For those who got lower prices than me, I congratulate you for outperforming me. When this current backtest of support in green ends, Sembcorp Marine will go for breakout of $3.00 psychological resistance.


Olam International: 28 February 2018, Wednesday, 2.43pm Singapore Time

Olam International: 
28 February 2018, Wednesday, 2.43pm Singapore Time
(Click on Technical Chart Above to Expand)

There are so many stocks that deserve to be added buys on the dip today. 
One of them is Olam International.

Look at how Olam is backtesting the Keltner band gracefully. 
This is like air Jordon in graceful display.
Add Buys on Dips now.


Straits Times Index Intraday: 28 February 2018, Wednesday, 11.59am Singapore Time

Straits Times Index Intra-day: 
28 February 2018, Wednesday, 11.59am Singapore Time
(Click on Technical Chart above to Enlarge)

Attached above is the Intra-day Technicals of the Straits Times Index using the Keltner Channel. It is getting difficult to ramp down the index using the 3 major banks (DBS, OCBC, UOB) now. These 3 index stocks alone (DBS, OCBC, UOB) contribute to a large portion of the STI Index. On the whole, the banks are suppressed to help chalk up buys for the index buying on the Straits Times Index, as well as on the Straits Times Index ETFs. The 3 banks cannot be suppressed for too long anymore as the indices are showing strength. The herd is getting panic once again in both Singapore and Malaysia and the herd continues to be dumping away to the smart hands. We may see some major movement coming from the afternoon session of the Asian markets.


Gains Track of The Donovan Norfolk Group: Investing-Trading Performance for 27 February 2018

Gains Track of The Donovan Norfolk Group: 
Investing-Trading Performance for 27 February 2018


Gains Track of The Donovan Norfolk Top 8 for KLSE,  Top 7 for NYSE and Top 5 for SGX: 
Investing-Trading Performance for 27 February 2018 Tuesday
【Updated on 28 February 2018 Wednesday】


The Below is the Gains Track of The Donovan Norfolk Top 8 for KLSE
(only those with gains will be jotted down)

Top 8: 【HENGYUAN】Performance, 27 Feb 2018: +4cents, +0.30%

Top 8: 【MALAYSIA STEEL WORKS】Performance, 27 Feb 2018: +2cents, +1.40%

Top 8: 【PRESS METAL ALUMINIUM】Performance, 27 Feb 2018: +2cents, +0.30%

Top 8: Sino Huaan, Hengyuan, Hibiscus, Masteel, Pmetal, GCB, Ssteel, AnnJoo


The Below is the Gains Track of The Donovan Norfolk Top 7 for NYSE
(only those with gains will be jotted down)

Top 7: 【ZENDESK】Performance, 27 Feb 2018: +31cents, +0.70%

Top 7: 【NATIONAL OILWELL VARCO】Performance, 27 Feb 2018: +8cents, +0.20%

Top 7: National Oilwell Varco (NYSE: NOV), Helmerich & Payne (NYSE: HP), Philips 66 (NYSE: PSX),  Kimbell Royalty Partners (NYSE: KRP), Bank of America (NYSE: BAC), Oriental Financial Group OFG Bancorp (NYSE: OFG), Zendesk Inc (NYSE: ZEN)


The Below is the Gains Track of The Donovan Norfolk Top 5 for SGX
(only those with gains will be jotted down)

Top 5: 【KEPPEL CORPORATION】Performance, 27 Feb 2018: +8cents, +1.00%

Top 5: 【SEMBCORP MARINE】Performance, 27 Feb 2018: +4cents, +1.80%

Top 5: DBS Bank, Olam International, Creative Technology, Keppel Corp, Sembcorp Marine


Congratulations 
and 
Best of Luck.

Gains Track Historical Records:
http://donovan-ang.blogspot.sg/search/label/Gains%20Track

Tuesday, 27 February 2018

Zendesk (NYSE: ZEN): 27 February 2018, Tuesday, 3.05pm Singapore Time

Zendesk (NYSE: ZEN): 
27 February 2018, Tuesday, 3.05pm Singapore Time
(Click on Technical Chart above to Enlarge)

Attached above is the Technicals for Zendesk (NYSE: ZEN), a company that is listed in the US market of NYSE. This stock has seen a total of 6 surges in buy volumes before its breakout at the break-away Gap Support Two of $31.43-$32.45 region. Markets are currently making the pink resistance-turned-support the minor support for continued up-move in this stock. With the strong volume flow, Zendesk is poised to move up significantly, with high upside which cannot be determined yet.

This stock will be added as The Norfolk Norfolk Group's Top 7 NYSE stocks for 2018 and 2019.
Bullish.

Gains Track of The Donovan Norfolk Group: Investing-Trading Performance for 26 February 2018


Gains Track of The Donovan Norfolk Top 8 for KLSE,  Top 6 for NYSE and Top 5 for SGX: 
Investing-Trading Performance for 26 February 2018 Monday
(Updated on 27 February 2018 Tuesday)


The Below is the Gains Track of The Donovan Norfolk Top 8 for KLSE
(only those with gains will be jotted down)

Top 8: 【ANN JOO RESOURCES】Performance, 26 Feb 2018: +10cents, +2.70%

Top 8: 【SOUTHERN STEEL】Performance, 26 Feb 2018: +4cents, +1.80%

Top 8: 【SINO HUA AN】Performance, 26 Feb 2018: +1cent, +1.70%

Top 8: 【GUAN CHONG BHD (GCB)】Performance, 26 Feb 2018: +1cent, +0.50%

Top 8: 【PRESS METAL ALUMINIUM】Performance, 26 Feb 2018: +1cent, +0.20%

Top 8: Sino Huaan, Hengyuan, Hibiscus, Masteel, Pmetal, GCB, Ssteel, AnnJoo


The Below is the Gains Track of The Donovan Norfolk Top 6 for NYSE
(only those with gains will be jotted down)

Top 6: 【BANK OF AMERICA】Performance, 26 Feb 2018: +39cents, +1.20%

Top 6: 【OFG BANCORP】Performance, 26 Feb 2018: +10cents, +0.90%

Top 6: 【HELMERICH & PAYNE】Performance, 26 Feb 2018: +57cents, +0.90%

Top 6: 【PHILIPS 66】Performance, 26 Feb 2018: +69cents, +0.80%

Top 6: 【KIMBELL ROYALTY PARTNERS】Performance, 26 Feb 2018: +15cents, +0.80%

Top 6: 【NATIONAL OILWELL VARCO】Performance, 26 Feb 2018: +11cents, +0.30%

Top 6: National Oilwell Varco (NYSE: NOV), Helmerich & Payne (NYSE: HP), Philips 66 (NYSE: PSX),  Kimbell Royalty Partners (NYSE: KRP), Bank of America (NYSE: BAC), Oriental Financial Group OFG Bancorp (NYSE: OFG)


The Below is the Gains Track of The Donovan Norfolk Top 5 for SGX
(only those with gains will be jotted down)

Top 5: 【CREATIVE TECHNOLOGY】Performance, 26 Feb 2018: +109cents, +37.80%

Top 5: 【OLAM INTERNATIONAL】Performance, 26 Feb 2018: +2cents, +0.90%

Top 5: 【KEPPEL CORPORATION】Performance, 26 Feb 2018: +6cents, +0.80%

Top 5: 【DBS BANK】Performance, 26 Feb 2018: +4cents, +0.10%

Top 5: DBS Bank, Olam International, Creative Technology, Keppel Corp, Sembcorp Marine


Congratulations 
and 
Best of Luck.

Gains Track Historical Records:
http://donovan-ang.blogspot.sg/search/label/Gains%20Track

Monday, 26 February 2018

Oriental Financial Group (NYSE: OFG): 26 February 2018, Monday, 12.33pm Singapore Time

Oriental Financial Group (NYSE: OFG): 
26 February 2018, Monday, 12.33pm Singapore Time
(Click on Technical Chart Above to Enlarge)

Attached above is the Technicals for OFG Bancorp/Oriental Financial Group (NYSE: OFG).
The green circled region is my live analyses back in 1H-2016 judging to load buys on Bank Stocks worldwide (syncing with world economic cycles). While Inverse Shoulder-Head-Shoulder chart formations are bullish in nature, Oriental Financial Group is doing double Inverse Shoulder-Head-Shoulders. This is extremely bullish in nature. NYSE: OFG is expected to break up the pink critical resistance as illustrated and to rally to break up for new multi-year highs. This indefinite up-move can be expected for 2018 and 2019.


Bank of America (NYSE: BAC): 26 February 2018, Monday, 11.55am Singapore Time

Bank of America (NYSE: BAC): 
26 February 2018, Monday, 11.55am Singapore Time
(Click on Technical Chart Above to Enlarge)

Attached above is the Technicals for Bank of America (NYSE: BAC), one of the US Banks selected by The Donovan Norfolk as top choice US Bank for investment during the 1st week of trading of 2018. 

The first green circled region is my live calls on 19 December 2012 to load buys on Bank of America Shares at $11.36 for lucrative returns as investor. It has yielded +2.82 folds in returns now, and a +181.95% profits right now. 

The second circled region is my embarrassing live calls on 29 December 2015 to load more average-up buys on US Bank Stocks such as Bank of America at $17.13, because DNA Technical Rating on Bank Stocks during December-2015 and start of 2016 back then was hyper bullish. It has yielded 1.87x in returns, and a +86.98% profits right now. 

The little rectangular region in February 2018 is the DNA live fore-warnings during early February 2018 that the February 2018 plunge worldwide are not prelude to any bear markets, but are merely used to shake out weak minded market herd who know nothing about the market.

At current $32.03, The Donovan Norfolk Technical Rating remains very bullish and sees Bank of America having the ability to rally way beyond $40.00 next, and doing so with a breeze in the park.


National Oilwell Varco (NYSE: NOV): 26 February 2018, Monday, 11.13am Singapore Time


National Oilwell Varco (NYSE: NOV):
26 February 2018, Monday, 11.13am Singapore Time
(Click on Technical Chart above to Expand)

Attached above is the technicals for National Oilwell Varco (NYSE: NOV), an oil and gas company listed in the US Market of NYSE and a component stock of S&P 500 Index. The crude oil stock is in newfound long term uptrend and had used the correction fear of February 2018 to backtest the double green support trend lines for confirmation of long term uptrend, i.e. confirmation of long term rally was done using FEAR of February of 2018. This was the case worldwide for many stocks across the board. As the new long term uptrend has been established using greatest fear, shaking out majority of the market herd, the stock can be expected to go up in 2018 and 2019.

This stock will be The Donovan Norfolk Top 6 to Top 8 Stocks of NYSE-NASDAQ.

Creative Technology: 26 February 2018, Monday, 9.07am Singapore Time

Creative Technology:
26 February 2018, Monday, 9.07am Singapore Time
(Click on Technical Chart above to Expand)

The following was my point of view in some sharings:

For Creative Technology, the market action is a speculation on the change to its fundamentals. If an entire sector, 90% of the companies are already overvalued, there can always still have 10% of companies that have innovation breakthroughs or some other breakthroughs and defy the industry valuation.

For instance if XYZ company in the tech industry suddenly discovered an A.I algorithm which can reliably forecast things such as human behaviour with precision, and can make a lot of money, this single tech company, out of a total of 2000 tech companies, can defy a trend within an entire industry and go 2 folds or 10 folds or even 100 folds up.

For Creative Technology case, the speculation on them was the realisation of '3D' sound to headphones after a US$100m R&D. Their Super X-Fi chip can recreate a customised listening experience. Assuming each chip costs $100 and it can sell 10m such chips a year, it will be $1 billion ($1000 million) returns a year.

This is why the market for Creative Technology rallied like that: a rally of more than +100% and holding this gain throughout the session to end with +130% gain.

As I have shared based on my past experiences, when a company is able to suddenly rally like that, of +100% in a single day, and hold on to all this gain throughout the day's session, and it is not a penny stock, it means the company has a drastic change in fundamentals. It often is able to rally 【at least】 another +100% or +200% in upside.

Whether it can rally more from there, i.e. rally more after another +100% profits, it will depend if the revolution is really a revolution and if the listening experience is really worth the money for the new improved experience.

We need to look for clues. There are 2 important clues that point to a new positive future.

1. "Since January, Creative has presented its Super X-Fi to headphone makers and the sceptical press - and received validation. Headphone manufacturers were blown away. They are willing to jump on the bandwagon, they know there's money here".

2. "The technology works so well that testers couldn't believe they were listening to a Dolby Atmos demo track on their headphones instead of an eight-piece home theatre system. Many would remove the headphones in disbelief and try to detect any external supporting sound."

Creative Technology: The shares soared S$1.63 to S$2.88, on a volume of 6.9 million as buyers latched on to what they hope would be a revival of Creative's glory days when it was the go-to maker of multimedia soundcards. Creative's share price had jumped over 130 per cent, adding over S$100 million to the Singapore soundcard maker's market cap in a single day.

What does this mean? This means that a mere maximum of $8.625 million dollars had been used to create a more than $100m jump in market capitalisation of the shares of Creative. This will induce shorting/selling pressure on Monday 26th February 2018 or at least some meaningful regression to a mean. If there is no selling pressure or that selling pressure is absorbed on Monday open, this means the smart monies in the market are currently judging that the 3D sound system's superchips are indeed good.

This will be added as my Top 5 Singapore Stock for Buys
(High Risk High Gain Stock; do your own due diligence)
Bullish (Buy)
Kimbell Royalty Partners (NYSE: KRP): 26 February 2018, Monday, 12.47am Singapore Time


Kimbell Royalty Partners (NYSE: KRP):
26 February 2018, Monday, 12.47am Singapore Time
(Click on Technical Chart above to Expand)

Attached above is the technicals for Kimbell Royalty Partners (NYSE: KRP), an oil and gas company listed in the US Market of NYSE. After the IPO, the market decided to let Kimbell Royalty Partners go into further accumulation mode below $17.20. The accumulation phase is as illustrated on technical chart attached above. Kimbell Royalty Partners had broken up the accumulation resistance in January 2018 and had used the correction fear of February 2018 to backtest the double brown classical lines of supports to make confirmation for new long term uptrend, i.e. confirmation of long term rally was done using FEAR of February of 2018 which was the case worldwide for many stocks all across the board. As the new long term uptrend has been established using greatest fear, the stock can be expected to go up in 2018 and 2019.


Helmerich & Payne (NYSE: HP): 26 February 2018, Monday, 12.23am Singapore Time

Helmerich & Payne (NYSE: HP):
26 February 2018, Monday, 12.23am Singapore Time
(Click on Technical Chart above to Expand)

Attached above is the technicals for Helmerich & Payne (NYSE: HP), an oil and gas company listed in the US Market of NYSE. The red circled regions are my live warnings in 2014 forewarning of a crude oil crash to come right after crude oil hit above $100 (refer to past track records timestamped and tracked live by many tens of thousands of followers). The green circled region is my live warnings in 1H-2016 calling for $30 crude oil to be the rock bottom (refer to past track records timestamped and tracked live by many tens of thousands of followers). Crude oil dipped slightly below $30 and never looked back. The 2 brown regions of volume flow are where markets engaged in absorption and eating up of sell queues -- bullish. The accumulation for the oil stock is nearing completion and will be going for mark-up phase as the next major phase of price movement. Super rally to $120 as next target can be expected. 


Sunday, 25 February 2018

Gains Track of The Donovan Norfolk Top 8 for KLSE and Top 4 for SGX: Performance for 23 February 2018 Friday, Updated on 25 February 2018 Sunday


Gains Track of The Donovan Norfolk Top 8 for KLSE and Top 4 for SGX: 
Investing/Trading Performance for 23 February 2018 Friday


The Below is the Gains Track of The Donovan Norfolk Top 8 for KLSE
(only those with gains will be jotted down)

Top 8: 【SINO HUAAN】Performance, 23 Feb 2018: +3cents, +5.30%

Top 8: 【MASTEEL】Performance, 23 Feb 2018: +3cents, +2.20%

Top 8: 【ANN JOO】Performance, 23 Feb 2018: +5cents, +1.40%

Top 8: 【HENGYUAN】Performance, 23 Feb 2018: +20cents, +1.30%

Top 8: 【HIBISCUS】Performance, 23 Feb 2018: +0.5cents, +0.50%

The Below is the Gains Track of The Donovan Norfolk Top 4 for SGX
(only those with gains will be jotted down)

Top 4: 【DBS BANK】Performance, 23 Feb 2018: +59cents, +2.00%

Top 4: 【OLAM INTERNATIONAL】Performance, 23 Feb 2018: +2cents, +0.90%

Congratulations 
and 
Best of Luck.

Gains Track Historical Records:
http://donovan-ang.blogspot.sg/search/label/Gains%20Track

Philips 66 (NYSE: PSX): 25 February 2018, Sunday, 11.04am Singapore Time

Philips 66 (NYSE: PSX):
25 February 2018, Sunday, 11.04am Singapore Time
(Click on Technical Chart Above to Expand)

Attached above is the Technicals for Philips 66, a quality crude oil related stock listed in NYSE. The dark green shaded region is The Donovan Norfolk Live Analysis Buys on Philips 66 on 28 July 2016. Philips 66 has since gone on to execute a large bullish ascending triangle brewing for large price up-moves. The current light green zone is the large scale backtest of resistance-turned-support for upmove of the following characteristics: 1. Long Term Rally 2. Rally of Significant Magnitude. Buy as much crude oil and energy related stocks as possible for the February 2018 support-backtest operations conducted worldwide. Quality oil stocks will spend 2018 and 2019 in full rally mode.

Past Philips 66 Analyses:

Friday, 23 February 2018

Sembcorp Marine: 23 February 2018, Friday, 10.01am Singapore Time

Sembcorp Marine: 
23 February 2018, Friday, 10.01am Singapore Time
(Click on Technical Chart Above to Expand)

Sembcorp Marine is using bad results of its Quarterly Corporate Report to violently shake out weak minded holders and investors. This shakeout is an important shakeout because the financial markets are brewing for a large new uptrend for crude oil related companies now. This shakeout will be very convincing and successful because it is done using bad news, and this usage of bad news to merely backtest large uptrend's double blue line supports will make weak minded investors and holders look very silly in 2019 and 2020 if they had indeed been bearish in 2018 because they use prevailing news to cloud their judgement. Markets are forward-looking  and pricing for $175-$180 per barrel crude oil, not current-looking nor even backwards looking for past results. 

For Sembmarine, how to catch bottom:
Enter in 3 batches:
One per mid-week starting from next week. 
Every wednesday enter 1 batch using Wednesday's opening price for 3 weeks

You will likely catch its bottom like how DBS bottom was caught at $16.00-$17.00 earlier by precision early bird followers using bad news. And DBS is now close to $30.00.

(Note: I am obliged to tell you that the above is not an inducement to trade or invest, and I bear no responsibility for your profits and losses. As a gentle reminder out of goodwill, never enter show hand everything in just 1 stock-equity, because there is always the fantastic 4 to average as a basket or that there are also other quality eggs out there to concoct with The Fantastic 4 for a pretty basket)

Best of Luck.


Gains Track of The Donovan Norfolk Top 8 for KLSE and Top 4 for SGX: Updated 23 February 2018 for Performance on 22 February 2018


Gains Track of The Donovan Norfolk Top 8 for KLSE and Top 4 for SGX: 
Updated 23 February 2018 for Performance on 22 February 2018


The Below is the Gains Track of The Donovan Norfolk Top 8 for KLSE
(only those with gains will be jotted down)

Top 8: 【HENGYUAN】 Performance, 22 Feb 2018: +26cents, +1.80%

Top 8: 【HIBISCUS】 Performance, 22 Feb 2018: +0.5cents, +0.50%


The Below is the Gains Track of The Donovan Norfolk Top 4 for SGX
(only those with gains will be jotted down)

(NIL)

The Below is of particular mention within The Donovan Norfolk Top 4 for SGX:

Top 8: 【SEMBCORP MARINE】 Performance, 22 Feb 2018: -30cents, -11.40%
Sembcorp Marine Technical Chart of 22 February 2018
(Click on Technical Chart Above to Expand)

Sembcorp Marine is using bad results of its Quarterly Corporate Report to violently shake out weak minded holders and investors. This shakeout is an important shakeout because the financial markets are brewing for a large new uptrend for crude oil related companies now. This shakeout will be very convincing and successful because it is done using bad news, and this usage of bad news to merely backtest large uptrend's double blue line supports will make weak minded investors and holders look very silly in 2019 and 2020 if they had indeed been bearish in 2018 because they use prevailing news to cloud their judgement. Markets are forward-looking pricing for $175-$180 per barrel crude oil, not current-looking nor even backwards looking for past results. 

For Sembmarine, how to catch bottom:
Enter in 3 batches:
One per mid-week starting from next week. 
Every wednesday enter 1 batch using Wednesday's opening price for 3 weeks

You will likely catch its bottom like how DBS bottom was caught at $16.00-$17.00 earlier by precision early bird followers using bad news. And DBS is now close to $30.00.

(Note: I am obliged to tell you that the above is not an inducement to trade or invest, and I bear no responsibility for your profits and losses. As a gentle reminder out of goodwill, never enter show hand everything in just 1 stock-equity, because there is always the fantastic 4 to average as a basket or that there are also other quality eggs out there to concoct with The Fantastic 4 for a pretty basket)

Congratulations 
and 
Best of Luck.

Gains Track of Top 8 in KLSE and Fantastic 4 of SGX:
http://donovan-ang.blogspot.sg/search/label/Gains%20Track

Thursday, 22 February 2018

Hibiscus (KLSE: 5199): Calculating Smart Money Tide's Average Holding Price and Projection of Tide's Target, 22 February 2018, 12.55am Singapore Time

Hibiscus (KLSE: 5199): 
Calculating Smart Money Tide's Average Holding Price and Projection of Tide's Target,
22 February 2018, 12.55am Singapore Time
(Click on Technical Chart above to Expand)

Attached is the cards-counting approach applied on Hibiscus Petroleum in the calculation of Smart Money Tide's Average Holding Price and Projection of Tide's Target. Before we begin this approach, we would need certain assumption to be true: that the retailers often make up a fixed z% volume flow with a fixed y-std-deviation such that the volume flow can be stably in fixed proportion for smart monies in the market. With this in mind and the Pareto Principle in effect, the market volume can now be reasonably fixed as majority belonging to smart money tide without distortion of data from retailers' volumes (everything in fixed proportion).

The 1st dark brown wording region is where the initial mess-up of chips occurred as international crude oil market raced towards the bottom. The 2nd dark brown wording region is where the messing up of chips ended to mark the end of a bottom. 

This was then followed with Main Wave 1 with its volume flow as highlighted in 1st orange zone. In this 1st orange zone, the aggregated volume is around x. The smart money tide's first batch of grabs from all sell queues on offer as well as absorption at the buy queues occurred in the range of 0.40-0.56 with median = 0.48 for this batch.

After slight doldrum in volumes, this was then followed with Main Wave 2 with its volume flow as highlighted in 2nd orange zone. In this 2nd orange zone, the aggregated volume is around 2x, approximately twice the flow of Main Wave 1. The smart money tide's second batch of grabs from all sell queues on offer as well as absorption at the buy queues occurred in the range of 0.60-1.16 with median = 0.88 for this batch.

For the entire Main Wave 1 + Main Wave 2, the Smart Money Tide's Estimated Average Holding Price = (1x0.48+2x0.88)/3 = 0.74667 for Hibiscus Petroleum. 

Compare now to the purple circled region on chart: this is why Hibiscus Petroleum rebounded very sharply from 0.76000 right after early-February's worldwide market correction ended. Because smart money tide's majority stockpile of longs are at around 0.74667. They need to protect the stockpiles of longs. The high volume protection zone had been set up in DARK GREEN RECTANGLE. This is an invisibly and invincibly strong SUPPORT.

Now, for effective distribution to be able to take place in future, prices need to go to at least 3x 0.74667 = 2.240 target price. This makes current prices close to majority of stockpiles held by smart money tide. This is why current prices are still extremely cheap, because there is a lot of room for more than +100% profits (more multi-fold run to come).

The Donovan Norfolk Technical Rating:
Bullish 
with 
MULTI-FOLD PROFIT UPSIDE

Past Hibiscus Analyses and Track Records:
https://donovan-ang.blogspot.sg/search/label/Hibiscus%20Petroleum

Top 8 Commodity Stocks of Malaysia:
(These trenders will continue to go trending up powerfully and widen the gap from the pack)
http://donovan-ang.blogspot.sg/2018/01/commodities-cyclical-upturn-to-come.html

Gains Track of The Donovan Norfolk Top 8 for KLSE and Top 4 for SGX: 22 February 2018

Gains Track of The Donovan Norfolk Top 8 for KLSE and Top 4 for SGX: 
22 February 2018


The Below is the Gains Track of The Donovan Norfolk Top 8 for KLSE
(only those with gains will be jotted down)

Top 8: 【SOUTHERN STEEL】 Performance, 21 Feb 2018: +1cent, +0.40%

Top 8: 【SINO HUAAN】 Performance, 21 Feb 2018: +1cent, +1.80%

Top 8: 【HENGYUAN】 Performance, 21 Feb 2018: +50cents, +3.50%


The Below is the Gains Track of The Donovan Norfolk Top 4 for SGX
(only those with gains will be jotted down)

Top 4: 【KEPPEL CORP】 Performance, 21 Feb 2018: +6cents, +0.70%

Top 4: 【OLAM INTERNATIONAL】 Performance, 21 Feb 2018: +3cents, +1.30%

Top 4: 【DBS BANK】 Performance, 21 Feb 2018: +79cents, +2.80%

Congratulations 
and 
Best of Luck.

Gains Track of Top 8 in KLSE and Fantastic 4 of SGX:
http://donovan-ang.blogspot.sg/search/label/Gains%20Track

Wednesday, 21 February 2018

WTI Crude Oil: 21 February 2018, Wednesday, 11.42am Singapore Time

WTI Crude Oil: 
21 February 2018, Wednesday, 11.42am Singapore Time
(Click on Technical Chart above to Expand)

Attached is the technicals for WTI Crude Oil. The entire orange region is full of buy volumes which support the international crude oil market. Crude oil related stocks worldwide remain long term bullish with plenty of upsides. The light green rectangular zone is where if the tail of the candle gets taken out, crude oil will hasten its up-move. The blue zone is where international financial-commodity markets did not chase down crude oil nor to strike it down when the momentum iron was hot. It is bullish in nature.

The Donovan Norfolk Technical Rating on Crude Oil:
Mid Term and Long Term Bullish on Crude Oil
(Crude Oil Target: $175-$180 per Barrel)


Gains Track of The Donovan Norfolk Top 8 for KLSE and Top 4 for SGX: 21 February 2018

Gains Track of The Donovan Norfolk Top 8 for KLSE and Top 4 for SGX: 
21 February 2018


The Below is the Gains Track of The Donovan Norfolk Top 8 for KLSE
(only those with gains will be jotted down)

Top 8: 【SINO HUAAN】Performance, 20 Feb 2018: +0.5cents, +0.9%


The Below is the Gains Track of The Donovan Norfolk Top 4 for SGX
(only those with gains will be jotted down)

Top 4: 【DBS BANK】Performance, 20 Feb 2018: +23cents, +0.8%

Top 4: 【OLAM INTERNATIONAL】Performance, 20 Feb 2018: +3cents, +1.3%

Congratulations 
and 
Best of Luck.

Gains Track of Top 8 in KLSE and Fantastic 4 of SGX:
http://donovan-ang.blogspot.sg/search/label/Gains%20Track

ComfortDelGro (Taxi Corporation): 21 February 2018, Wednesday, 6.17am Singapore Time


ComfortDelGro (Taxi Corporation): 
21 February 2018, Wednesday, 6.17am Singapore Time
(Click on Technical Chart above to Expand)

Attached above is the technicals of ComfortDelGro, a taxi corporation that is listed in Singapore SGX. The brown volume flow shows where impulsive selling volume started taking over in the market for this company. 

The entire series of RED rectangular boxes show where high volume selling took place and these price actions never saw their ground being recovered by the amber boxed volume flows. The 2nd amber boxed volumes are high volume rebounds which could not save prices. This is a humongous red flag in the realm of volume analysis. Worse, this high volume merely aided the price actions to be capped within a bearish rounding formation which sees gradients of selling getting more and more desperate, and more and more impulsive. 

Based on price actions and volume flow in the technicals, it appears ComfortDelGro may soon transit to an accelerated phase of strong plunge soon. Often such a phase will be characterized by longs trampling longs in a bid to exit at all costs. 

Based also on overall technical price structure and overall volume flow, and based on past histories of charts with the above bearish characteristics, most of the time charts displaying such characteristics will result in an accelerated plunge of yet another at least more than -50% loss in share prices. The current pink bear flag as highlighted on the technical chart is another mini price structure that is part of the entire large bearish rounding price structure in blue. It appears a jump off the cliff may be inevitable soon based on Chart T.A Technicals.

The Donovan Norfolk Technical Analysis Rating:
Very Bearish on ComfortDelGro


Tuesday, 20 February 2018

Gains Track of The Donovan Norfolk Top 8 for KLSE and Top 4 for SGX: 20 February 2018


The Below is the Gains Track of The Donovan Norfolk Top 8 for KLSE
(only those with gains will be jotted down)

Top 8: 【PMETAL】 Performance, 19 Feb 2018: +6cents, +1.10%

Top 8: 【MASTEEL】 Performance, 19 Feb 2018: +2cents, +1.50%

Top 8: 【ANN JOO】 Performance, 19 Feb 2018: +6cents, +1.60%

Top 8: 【SOUTHERN STEEL】 Performance, 19 Feb 2018: +8cents, +3.50%

Top 8: 【SINO HUAAN】 Performance, 19 Feb 2018: +5cents, +9.80%

Top 8: 【HIBISCUS】 Performance, 19 Feb 2018: +9.5cents, +10.10%

Top 8: 【HENGYUAN】 Performance, 19 Feb 2018: +198cents, +15.20%


The Below is the Gains Track of The Donovan Norfolk Top 4 for SGX
(only those with gains will be jotted down)

Top 4: 【DBS Bank Performance】, 19 Feb 2018: +15cents, +0.50%

Top 4: 【Keppel Corp】 Performance, 19 Feb 2018: +21cents, +2.60%

Top 4: 【Olam International】 Performance, 19 Feb 2018: +6cents, +2.80%

Top 4: 【Sembcorp Marine】 Performance, 19 Feb 2018: +14cents, +5.60%

Congratulations 
and 
Best of Luck.

Monday, 19 February 2018

Malaysia Steel Works (KLSE: 5098): 19 February 2018, Monday, 9.50am Singapore Time

Malaysia Steel Works (KLSE: 5098): 
19 February 2018, Monday, 9.50am Singapore Time
(Click on Technical Chart Above to Expand)

Attached is the technicals for Malaysia Steel Works, a stock listed in the Emerging Market of Malaysia (KLSE: 5098). 

The dark green region is my live analyses back in 1H-2016 calling 1H-2016 to be rock bottom of Asian markets' bearish weakness of 2H-2013 to 2H-2015 which caused most people to lose most money in the most fakely bullish times (using index strength to kill broad market stocks). This mostly enacted per my live warnings, including the precision bottom.

The light green region is my live analyses in 2H-2016 and November 2016 calling for strong buys in steel stocks, metal stocks and raw material stocks (Refer to past track records attached below that had been time-stamped and tracked by followers worldwide). Many of my followers are already sitting on huge gains on steel/metal stocks such as USX-Steel Corp (NYSE), Angang (HKSE), Press metal (KLSE), Malaysia Steel (KLSE) and Southern Steel (KLSE).

  The series of high volume flows as indicated by the dark green volumes are all impulsive buy volumes which ate up everything at the sell queues on offer. There were not much unloads each time after the big buys occurred in the market, if there was any as indicated by the orange rectangular zone of volumes, these volumes were absorbed nicely by invisible hands. Most of the time only naive and ignorant retail investors and day traders are getting out at low prices but smart monies continuously took over the buy positions. 

Malaysia Steel Works also easily executed a gap-up with high volume recently in February of 2018, eating up everything at the sell queue on offer. This is done right after the worldwide fearful correction of February 2018. While everyone sells, the smart monies grabbed the opportunity to eat up everything on offer once again. This is a display of high confidence that the stock price is still very cheap based on future earnings this company is to continue to reap in.

Based on the entire series of volume flow, Malaysia Steel Works has yet another +100% profits upside from here. This gives Malaysia Steel Works the next target price of 2.70. This represents +563% returns from my 1H-2016 scoop-the-bottom operations, +281% returns from my November-2016 scoop the bottom operations and a +200% returns from my February-2018 scoop-the-bottom operations (for averaged up addition of buys on Steel-Metal stocks worldwide).


The Donovan Norfolk Technical Ratings:
HIGHLY BULLISH ON COMMODITIES-RAW MATERIALS SUCH AS STEEL AND METALS


Past Analysis on Steel and Metals Worldwide (Track Records):

(These trenders will continue to go trending up powerfully and widen the gap from the pack)
http://donovan-ang.blogspot.sg/2018/01/commodities-cyclical-upturn-to-come.html


Southern Steel (KLSE: 5665): 19 February 2018, Monday, 8.43am Singapore Time

Southern Steel (KLSE: 5665): 
19 February 2018, Monday, 8.43am Singapore Time
(Click on Technical Chart Above to Expand)

Attached is the technicals for Southern Steel, a stock listed in the Emerging Market of Malaysia (KLSE: 5665). 

The dark green region is my live analyses back in 1H-2016 calling 1H-2016 to be rock bottom of Asian markets' bearish weakness of 2H-2013 to 2H-2015 which caused most people to lose most money in the most fakely bullish times (using index strength to kill broad market stocks). This mostly enacted per my live warnings, including the precision bottom.

The light green region is my live analyses in 2H-2016 and November 2016 calling for strong buys in steel stocks, metal stocks and raw material stocks (Refer to past track records attached below that had been time-stamped and tracked by followers worldwide). Many of my followers are already sitting on huge gains on steel/metal stocks such as USX-Steel Corp (NYSE), Angang (HKSE), Press metal (KLSE), Malaysia Steel (KLSE) and Southern Steel (KLSE).

  The series of high volume flows as indicated by the dark green volumes are all impulsive buy volumes which ate up everything at the sell queues on offer. There were not much unloads each time after the big buys occurred in the market. Most of the time only naive and ignorant retail investors and day traders are getting out at low prices but smart monies continuously took over the buy positions. 

Southern Steel also easily executed a gap-up with high volume recently in February of 2018, eating up everything at the sell queue on offer. This is done right after the worldwide fearful correction of February 2018. While everyone sells, the smart monies grabbed the opportunity to eat up everything on offer once again. This is a display of high confidence that the stock price is still very cheap based on future earnings this company is to continue to reap in.

Based on the entire series of volume flow, Southern Steel has yet another +100% profits upside from here. This gives Southern Steel the next target price of 4.56. This represents +608% returns from my 1H-2016 scoop-the-bottom operations, +368% returns from my November-2016 scoop the bottom operations and a +200% returns from my February-2018 scoop-the-bottom operations (for averaged up addition of buys on Steel-Metal stocks worldwide).


The Donovan Norfolk Technical Ratings:
HIGHLY BULLISH ON COMMODITIES-RAW MATERIALS SUCH AS STEEL AND METALS


Past Analysis on Steel and Metals Worldwide (Track Records):

(These trenders will continue to go trending up powerfully and widen the gap from the pack)
http://donovan-ang.blogspot.sg/2018/01/commodities-cyclical-upturn-to-come.html