Ticker 1

Ticker 2

Click "Like" to Receive First Hand Updates From The Analysis Site / Click "SHARE" to share

Friday 28 September 2018

Technical Analysis of Netflix Inc (NASDAQ: NFLX): 28 September 2018, Friday, 2.40pm Singapore Time

Technical Analysis of Netflix Inc (NASDAQ: NFLX): 
28 September 2018, Friday, 2.40pm Singapore Time
(Click on Technical Chart above to Expand)

Attached is the Technicals of Netflix Inc (NASDAQ: NFLX). When Netflix was at $157.20 just May last year 2017, I gave a buy rating/bullish rating of Netflix fore-warning that it would rise another 3x from $157 based on volume flow.  It has risen close to +300% but I am still bullish on Netflix for more upsides. On 13 September 2018, when Netflix was $370.93, based on volume flow, I gave it yet another buy rating/bullish rating, pre-empting that Netflix would rise beyond $420 per share -- the Marijuana magic number which was also used by Elon Musk on Tesla "privatisation". Netflix also has this Marijuana Magic Number of 420 at the resistance. This is a special stock -- the $420 resistance level is deliberate. Once this $420 breaks out, it will fly high like Mari-Aurora (Marijuana theme in US).

Technical Analysis of Bank of America (NYSE: BAC): 28 September 2018, Friday, 2.25pm Singapore Time

Technical Analysis of Bank of America (NYSE: BAC): 
28 September 2018, Friday, 2.25pm Singapore Time
(Click on Technical Chart above to Expand)

Attached is Technicals of Bank of America (NYSE: BAC). The double black support-resistance lines are actually a large bull flag within a larger long term uptrend. Bank of America's correction is ending. It is in light green support zone as highlighted. Fundamentals of Bank of America remain rock solid. The black channel is expected to be broken up at $31.25 for a powerful rally as indicated by the green trajectory.

SGDCNY (Singapore Dollar against the Chinese Yuan): 28 September 2018, Friday, 12.32pm Singapore Time

SGDCNY (Singapore Dollar against the Chinese Yuan): 
28 September 2018, Friday, 12.32pm Singapore Time
(Click on Technical Chart above to Expand)

Attached is the Technicals for the Singapore Dollar against the Chinese Yuan (China Renminbi). The SGDCNY has completed its large accumulation of bullish cup-and-handle guided by the red trendlines. The breakout has been achieved. This gives a projection upwards of 5000 pips. Another round of sharp Chinese Currency depreciation/devaluation is coming since the SGD has been relatively stable against the basket of the other 8 major currencies of the world. The real reason for the trade war could be becoming clear. US is winning the trade war, inflicting such volatility in the Chinese Yuan, and with Chinese Yuan needing to keep depreciating to jump-start the economy. China's fragility is exposed nakedly. There is right now a loss of confidence in Chinese Yuan among the international finance community. China's dream of settlement of Crude Oil using Chinese Yuan in the Chinese Exchange has been shattered to pieces by the on-going trade war. It looks like any future attempt to try to displace the USD will result in more trade wars. US Dollar would likely remain the undisputed international currency of settlement, as well as the benchmark, for some time or a long time.


Thursday 27 September 2018

Technical Analysis of General Electric (NYSE: GE): 27 September 2018, Thursday, 1.18pm Singapore Time


Technical Analysis of General Electric (NYSE: GE): 
27 September 2018, Thursday, 1.18pm Singapore Time
(Click on FFA Chart above to Expand)

Attached is Technicals of General Electric (NYSE: GE). Following my warnings that smart monies are selling and shorting GE of 22 March 2018 (link attached below), General Electric has continued to fall into an abyss. Congratulations to short-sellers for your profits. General Electric has broken down the black minor support as illustrated at $12.66 region and even backtested this $12.66 as resistance successively. For those who have picked up my special SCTR skills which I had shared and taught selflessly, you could even see for yourself the 1st amber flag, 2nd warning flag and last red warning flag on GE suggesting to sell or short it when it was $30, $29 and $28 respectively. GE is now $11.39 with indefinite downmove to come.

Previous Funds Flow Analysis of General Electric:


Wednesday 26 September 2018

Singapore Straits Times Index: 26 September 2018, Wednesday, 1.29pm Singapore Time


Singapore Straits Times Index: 
26 September 2018, Wednesday, 1.29pm Singapore Time
(Click on Technical Chart above to Expand)

Attached is the Technicals of Singapore Straits Times Index reflecting the market conditions of Singapore and Worldwide Financial Markets -- Singapore being the most reliable indicator for economic health of the world. The Mid Term Significant Bullish Wedge of Re-accumulation in Black-lined structure has successfully been completed. This bullish wedge of shakeout has successfully shaken out many mentally weak investors and traders, and is a prelude of the next half of the Super-Cycle (S.C) humongous upmove to come. Majority of market investors and traders judged that we are in bear market, however, as reiterated, we are at merely the 50th percentile (midway) of a long term (S.C) bull market.


Tuesday 25 September 2018

TESLA Inc (NASDAQ: TSLA): 25 September 2018, Tuesday, 12.17am Singapore Time


TESLA Inc (NASDAQ: TSLA): 
25 September 2018, Tuesday, 12.17am Singapore Time
(Click on Technical Chart above to Expand)

Attached is the Technicals for TESLA Inc (NASDAQ: TSLA). I am taking profits of my Tesla Longs of $291.62 entered on 17 September 2018. I am taking all profits off the table now at $296.70.


Thursday 20 September 2018

Updated Technicals of DBS (Development Bank of Singapore): 20 September 2018, Thursday, 11.30am Singapore Time


Updated Technicals of DBS (Development Bank of Singapore): 
20 September 2018, Thursday, 11.30am Singapore Time
(Click on Technical Chart above to Expand)

Attached is the updated technicals for DBS (Development Bank of Singapore). Technical levels and forward projection (in brown trajectory) as illustrated on the chart itself. Study in detail to discover the genius with respect to timeline in each of the turns. DBS has strength, suggesting that smart monies' re-accumulated massive buys chalked up from January 2016 were not too much unloaded when institutions needed to adjust risk during the mid-term healthy correction. Market makers (strong hands) had been willing to support too based on volume flow. Based on the exchange-of-hands, without letting the price correcting down much, the implication is that the forward fundamentals of DBS remain robust.


Wednesday 19 September 2018

Oracle Corp (NYSE: ORCL): 19 September 2018, Wednesday, 11.34pm Singapore Time


Oracle Corp (NYSE: ORCL): 
19 September 2018, Wednesday, 11.34pm Singapore Time
(Click on Technical Chart above to Expand)

Attached is the technicals for Oracle Corp (NYSE: ORCL). Oracle displayed a midterm bullish divergence of significant scale and its correction ended with a fake breakdown as illustrated by the blue circled region. This fake breakdown is an intense re-accumulation operation. Fake breakdowns are essentially very bullish in nature. Two previous falling windows of resistances are now re-captured and act as support bands 1 and 2 now -- illustrated as dark green bands on chart. There is furthermore another layer of buying pressure at the light green zone formed by 50MA above the 200MA. This region is also behaving as support band now. Oracle is now ready for more uptrends for 4Q-2018 and 1Q-2019. Bullish.


Alibaba Group Holdings (NYSE: BABA): 19 September 2018, Wednesday, 10.02pm Singapore Time


Alibaba Group Holdings (NYSE: BABA): 
19 September 2018, Wednesday, 10.02pm Singapore Time
(Click on Technical Chart above to Expand)

Attached above is the technicals for Alibaba Group Holdings that is listed in the US Market (NYSE: BABA). Despite the technical breakdown, I am officially ending my bearishness on Alibaba now -- prematurely. Those who chalked up Alibaba shorts with me at $172.23, you can take all profits now at $161.34. I am bullish or at least not bearish on Alibaba anymore. It looks like Alipay's Union with Unionpay in China may reap even more explosive rewards.

Past Alibaba Analyses:
http://donovan-ang.blogspot.com/search/label/Alibaba

Tuesday 18 September 2018

3M Co. (NYSE: MMM): 18 September 2018, Tuesday, 7.43pm Singapore Time

3M Co. (NYSE: MMM): 
18 September 2018, Tuesday, 7.43pm Singapore Time
(Click on Technical Chart above to Expand)

Attached is the Technicals for 3M Company (NYSE: MMM). The 2 rectangular bands are resistance bands suppressing 3M Co., and these 2 resistance bands will continue to be used by Wall Street to sell down the stock. 3M has now hit the limit of the 2nd resistance band. It is a high selling pressure zone for re-accumulation of SHORTS. There are 2 bear flags in the technical chart as illustrated -- one is illustrated by the purple lines and the other is illustrated by the pink circled region. 3M will be one of the casualties of a US-China Trade War. 3M is a short-selling stock for the short-mid term. It is not for buying. It is for shorting/selling. 1st TP: $200. 2nd TP: $190. 3rd TP: break down $190.

NIO Inc (NYSE: NIO): 18 September 2018, Tuesday, 1.03am Singapore Time


NIO Inc (NYSE: NIO): 
18 September 2018, Tuesday, 1.03am Singapore Time
(Click on Technical Chart above to Expand)

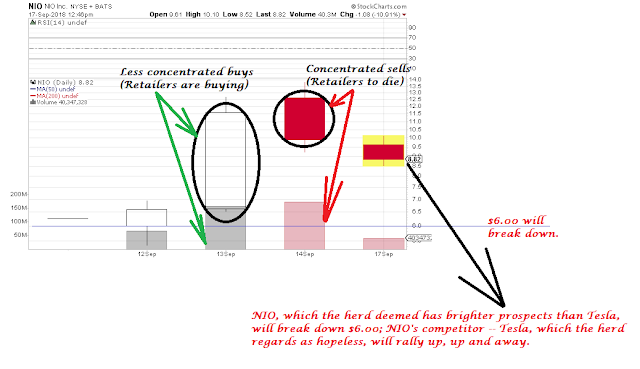
Attached is the Technicals for NIO Inc (NYSE: NIO). The less concentrated buy as illustrated on chart is where retailers had been buying. The highly concentrated and highly focused sells as illustrated on chart is where retailers' nightmare will begin. Less concentrated buy is met with highly concentrated sells -- retailers (the herd) are to die with a breakdown of $6.00 support. NIO, which the herd deemed to have brighter prospects than Tesla, will break down $6.00. NIO's competitor -- Tesla, which the herd regards as hopeless, will rally up, up and away. My takes on NIO-Tesla pair is reaping rewards. I will reverse only when the crowd is bullish of Tesla and despair on NIO.

Monday 17 September 2018

TESLA Inc (NASDAQ: TSLA): 17 September 2018, Monday, 9.47pm Singapore Time

TESLA Inc (NASDAQ: TSLA): 
17 September 2018, Monday, 9.47pm Singapore Time
(Click on Technical Chart above to Expand)

Attached is the Technicals for TESLA Inc (NASDAQ: TSLA). The 2 light-green circled regions are my live warnings not to short TESLA with the high profile hedge funds' shorts out there, because there could be larger and stronger hands who are longs on Tesla based on Tesla Funds Flow card-counting of the volumes. The technical chart above illustrates the volume flow. Following my warning, Tesla has flipped and recaptured its broken-supports now (tentative fake breakdown). Market is rampant with Tesla shorts and Tesla is one of the most overcrowded shorts in the US Market now. If I am invisible hands, I will rock the boat and drown all the shorts out there. I am buying Tesla now @$291.62. Prolific Tesla buyers will drown out the prolific Tesla shorts in the short term and mid term.


Microsoft Corp (NASDAQ: MSFT): 17 September 2018, Monday, 2.53pm Singapore Time

Microsoft Corp (NASDAQ: MSFT): 
17 September 2018, Monday, 2.53pm Singapore Time
(Click on Technical Chart above to Expand)

Attached is the Technicals for Microsoft. 
Short Term Short-Sell at $113.00-$113.37.
Take profits of Shorts at around $100.00.
(Short Term Correction within Long Term Uptrend)

Saturday 15 September 2018

Updated Technicals of Facebook Inc (NASDAQ: FB): 15 September 2018, Saturday, 6.03pm Singapore Time

Updated Technicals of Facebook Inc (NASDAQ: FB): 
15 September 2018, Saturday, 6.03pm Singapore Time
(Click on Technical Chart above to Expand)

Attached is the updated Technicals for Facebook Inc (NASDAQ: FB). The 2 Red Circled Regions are my warnings since start of 2018 to get out of FB, highlighting that even Zukerberg and management had been furiously selling their FB shares at such good valuations. I also called on my followers to take all the >+700% profits off the table since following me, and to hold no FB shares. The brown circled region is where the formation/condition consisting of the 3 purple lines guarantee the breakdown of $160 to come and Facebook will slam below $150 psychological support for short-selling victory. Congratulations to everyone, and best of luck.


Thursday 13 September 2018

NetFlix Inc (NASDAQ: NFLX): 13 September 2018, Thursday, 9.45pm Singapore Time


NetFlix Inc (NASDAQ: NFLX): 
13 September 2018, Thursday, 9.45pm Singapore Time
(Click on Technical Chart above to Expand)

Attached is the updated Technicals for NetFlix Inc (NASDAQ: NFLX). This is a stock which will rally regardless of big index performance, and will rally regardless of trade war or no trade war. The volume absorption by smart monies is as indicated on chart. Following that, the stock underwent a significant short-mid term re-accumulation of low volume with inverse Shoulder-Head-Shoulder formed in light green illustration. The inverse neckline is in dark green. The accumulation is completing. NetFlix will super rally to new highs as projected by the trajectory as on technical chart. $420 will break out upwards like a breeze. 


Diamondback Energy (NASDAQ: FANG): 13 September 2018, Thursday, 5.45pm Singapore Time

Diamondback Energy (NASDAQ: FANG): 
13 September 2018, Thursday, 5.45pm Singapore Time
(Click on Technical Chart above to Expand)

Attached is the updated Technicals for Diamondback Energy (NASDAQ: FANG), one of my most favourite stocks in the US Market. It is the Apple of the Crude Oil-Energy Industry. The immediate support has been re-captured. Defining candle and price as illustrated on technical chart attached. The entire dark green zone is a support zone with buying pressure. The previous gap-down volume circled in light green had been volume absorption. Invisible hands are supporting this stock. This means $138 resistance will break out upwards. Momentum is swinging up, and there are even bullish divergences in momentum now for Diamondback Energy. Bullish. Buy.


Monday 10 September 2018

Updated Technicals of Development Bank of Singapore (DBS): 10 September 2018, Friday, 11.01am Singapore Time


Updated Technicals of Development Bank of Singapore (DBS): 
10 September 2018, Friday, 11.01am Singapore Time
(Click on Technical Chart above to Expand)

Attached is the updated Technicals for Development Bank of Singapore (DBS).
All Technicals are illustrated, self-explained and elaborated on the chart itself.
Note that I had been concurrently shorts on China and my China shorts as hedges are all green and in the money (with profits). China shorts are acting as short term hedges for long term uptrend of worldwide markets. My view is still not changed despite Trump administration pushing out another batch of tariff on China -- we are still in Super-Cycle Bull Market, and I do not see any Bear Market coming. The forecast for the economic cycle is still not derailed: we are in the mid-point of a worldwide Super-cycle Bull Market -- 2008-2018 is the first half, 2018 is shakeout at midpoint, and 2018-2028 is the second half of Super-cycle Bull where majority gains are made. 


Friday 7 September 2018

Updated China 300 Index Technicals reflecting Equity Markets of China and Hong Kong: 7 September 2018, Friday, 11.55am Singapore Time

Updated China 300 Index Technicals reflecting Equity Markets of China and Hong Kong: 
7 September 2018, Friday, 11.55am Singapore Time
(Click on Technical Chart above to Expand)

Attached is the technicals for China 300 Index. Following my August 2018 expectation that the US President, Donald Trump, will fire his last round of salvos on China in September and October of 2018 (leading to midterm elections on first week of November 2018), China is now battered, yet again. All my short-mid term shorts on China which I had chalked up earlier have now turned into good profits for each and every batch of the shorts on China. In addition, China market has broken down orange support trendline in the immediate term, while being resisted in the short term. This means my expectation on China is turning true. Note that all other markets worldwide will still be within the SCTR spectrum which I had laid out earlier, with US markets and India markets being the most bullish.
(Short-mid term China Shorts are merely acting as hedge for my long term investment longs portfolio)

Related Trade:
Direxion Daily FTSE China Bear 3x ETF shares (AMEX: YANG) @$60.92

Thursday 6 September 2018

Cliffs Natural Resources Inc / Cleveland-Cliffs (NYSE: CLF): 6 September 2018, Thursday, 8.15pm Singapore Time

Cliffs Natural Resources Inc / Cleveland-Cliffs (NYSE: CLF):
6 September 2018, Thursday, 8.15pm Singapore Time
(Click on Technical Chart above to Expand)

Attached is the Technicals for Cliffs Natural Resources Inc / Cleveland-Cliffs (NYSE: CLF). After executing a bull's pole with high impulsive volume flow, and consolidating with low volumed bull flag, Cliffs (NYSE: CLF) is preparing for the next large wave of upmove. The momentum in the MACD and RSI are getting ready as well. Outlook for 4Q-2018 and 2019: Bullish. Expect $11.50 to break up within the coming 1-2 Quarters.


ADP Non-Farm Employment Change: Why US Markets (DJIA, S&P500, NASDAQ) will continue to Super-Rally


ADP Non-Farm Employment Change: 
Why US Markets (DJIA, S&P500, NASDAQ) will continue to Super-Rally
(Click on Statistical Chart above to Expand)

Attached above is the ADP Non-Farm Employment Change showing why the US Markets (DJIA, S&P500, NASDAQ) will continue to Super-Rally. Golden bars are forecasts and Blue bars are actual figures. It is glaring that since the start of Trump's Presidency, the non-farm employment change had been consistently and overwhelmingly outperforming. This may not be by chance as the rejuvenation and out-performance compared to market expectations had been consistent and sterling. The policies are working. The trend is one's best friend, and the DJIA for instance will break up 30,000 point psychological resistance, like hot knife through butter.

Wednesday 5 September 2018

Updated China 300 Index Technicals reflecting Equity Markets of China and Hong Kong: 5 September 2018, Wednesday, 2.57pm Singapore Time

Updated China 300 Index Technicals reflecting Equity Markets of China and Hong Kong: 
5 September 2018, Wednesday, 2.57pm Singapore Time
(Click on Technical Chart above to Expand)

Attached above is the technicals for China 300 Index. Following my August 2018 expectation that the US President Donald Trump will fire last round of salvos on China in September and October of 2018 leading to midterm elections on first week of November 2018, China is now battered again. I am adding some shorts again on China at 3253.5 points.
(Short-mid term China Shorts acting as hedge for my long term investment longs portfolio)

Related Trade:
Direxion Daily FTSE China Bear 3x ETF shares (AMEX: YANG) @$60.92

Tuesday 4 September 2018

AMD Advanced Micro Devices (NASDAQ: AMD): 4 September 2018, Tuesday, 10.38pm Singapore Time


AMD Advanced Micro Devices (NASDAQ: AMD): 
4 September 2018, Tuesday, 10.38pm Singapore Time
(Click on Technical Chart above to Expand)

Attached is the technicals for AMD Advanced Micro Devices (NASDAQ: AMD). This is the kind of stock that will continue to do well without the protection of trade war and have icing on the cake with the protection of a trade war (protection of chips' IPs). Couple with AMD chips' breakthroughs and AMD's quest and progress to build chips that can beat Intel, this company is a winner. It has a high SCTR scoring and ranking within the industry since May 2018. On the back of this SCTR high scoring, it therefore rose from $10 to $26 in a shoort span of 4 months. Volume flow, as illustrated, is also bullish where smart money bulls are in firm control. AMD continues to be a trading buy/long at current price ($26.44), and will continue to go up indefinitely in the whole of 2019. 


US Light Crude Oil (WTI Oil): 4 September 2018, Tuesday, 3.00pm Singapore Time

US Light Crude Oil (WTI Oil): 
4 September 2018, Tuesday, 3.00pm Singapore Time
(Click on Technical Chart above to Expand)

Attached is the 4-Hourly Crude Oil Technicals.
I am adding some more Longs on US Light Crude Oil (WTI Oil) @ 7004.5 points ($70.045 per barrel). Technicals as attached. Crude oil has broken up black resistance trend band as illustrated on chart. It has also broken up the 50MA and 200MA resistance and turned them into green supports. It has also backtested successfully the multiple smoothed MA in blue as support.
Take short term profits at 7344 points ($73.44 per barrel). Crude oil related stocks may have a buying pressure as well, especially those listed in the US markets.


Saturday 1 September 2018

Tencent Holdings (HKSE: 0700): 1 September 2018, Saturday, 12.30am Singapore Time


Tencent Holdings (HKSE: 0700): 
1 September 2018, Saturday, 12.30am Singapore Time
(Click on Technical Chart above to Expand)

Attached is the technicals for Tencent Holding that is listed in Hong Kong (HKSE: 0700). The technical on Tencent is for shorting. Tencent Holding has a gap-down Support-Turned-Resistance Band in Red in the hourly chart. This red band is used as launchpad to batter the stock down. In the 4-hourly chart, using this falling-window's show of intention, it is clear that $320.00 will break down with the momentum. The momentum is impulsive, meaning $320.00 support will have more than 90% probability of breaking down fast. In the daily chart for Tencents, it is now showing an even more bearish formation -- bearish expanding triangle. The Tencent Holding target price projected down to satisfy a large structure Shoulder-Head-Shoulder to end the correction will be $264.60-$266.00.

Additional Note :
Note that at TP of $264.60-$266.60, The long term uptrend of Tencent Holdings is not derailed at all.