Ticker 1

Ticker 2

Click "Like" to Receive First Hand Updates From The Analysis Site / Click "SHARE" to share

Sunday 29 December 2019

Technicals of Lumber for Trading: 29 December 2019, Sunday


Technicals of Lumber for Trading:
29 December 2019, Sunday
(Click on the Technical Chart Above to Expand)

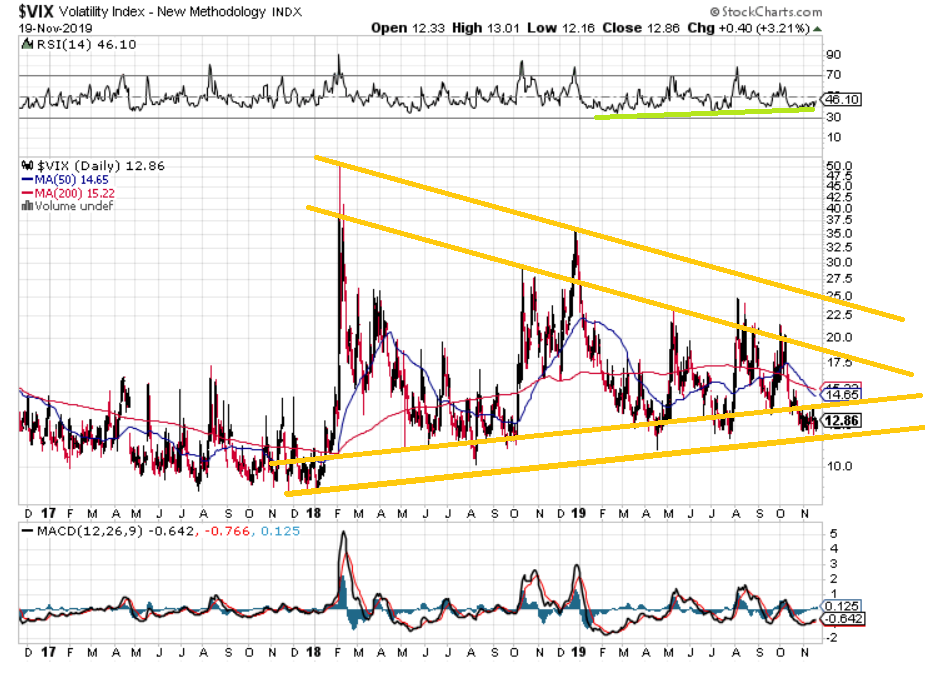
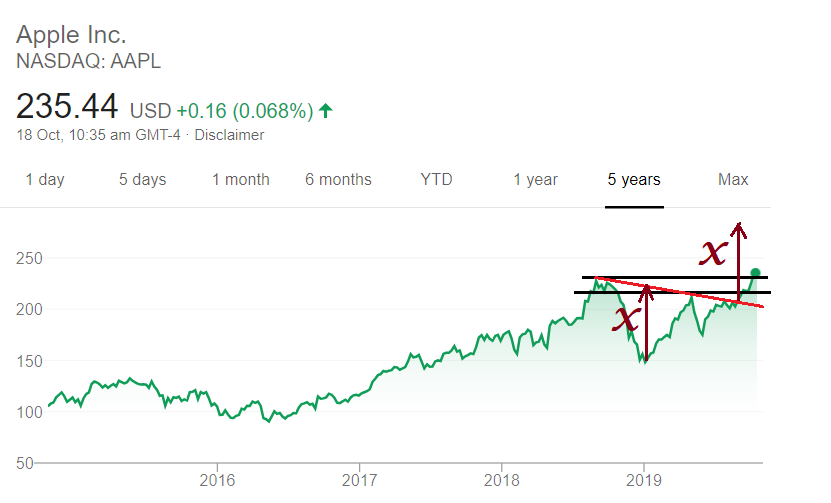
Attached is the Technicals for Lumber. Lumber is a buy/long now whether for trading or investing for the short-mid term. Australia is burning, and the forest fires are at a critical emergency state now. Huge amount of forests have been burnt in South East Asia, Brazil, US and Australia this year. The market has not fully digested the extent of the damage yet, and with global warming, it will not get any better. The best hedge for many countries' governments is to go into lumber market and buy up lumber ETFs, lumber contracts and lumber derivatives now, so that future expensive wood resources can be subsidized more cheaply by the current hedges of intensive buys. Expect lumber prices to shoot up. The technical chart, with the illustrated tangents, support my point.

The Donovan Norfolk Technical Rating:
Bullish

DISCLAIMER

This analysis site, as well as the analyses in it, is created for the sole purpose of education, discussion, fundamental analysis knowledge sharing, technical analysis knowledge sharing, funds flow analysis knowledge sharing, general skills-knowledge sharing and opinions sharing. The contents of this blog are not to be taken as investment advice or inducement to trade, and I take no responsibility for any gains or losses as a result of reading my analyses, judgements and opinions. In essence, practise due diligence. 

Wilmar International: 29 December 2019, Sunday

Updated Technicals of Wilmar International:
29 December 2019, Sunday
(Click on the Technical Chart Above to Expand)

Attached is the Updated Technicals of Wilmar International. The entire yellow circled region was forewarned by me, before prices moved, that Palm Oil and good palm oil stocks worldwide, such as Wilmar, will make a great bullish rounding bottom for a super rally. When most people were gloom and doom on palm oil, I turned into high optimism. In the middle of this year 2019 and reiterated in 3Q-2019, I had said that palm oil was going to have extreme rally, and it is all happening now, true to my words (refer to past live track records as attached below). Wilmar will challenge for $7.11 long term technical resistance in the resumed cycle for palm oil, and is expected to break up $7.11 resistance like a hot knife cutting through butter.

The Donovan Norfolk Technical Rating:
Bullish

Past Wilmar Analyses:
http://donovan-ang.blogspot.com/search/label/Wilmar

DISCLAIMER

This analysis site, as well as the analyses in it, is created for the sole purpose of education, discussion, fundamental analysis knowledge sharing, technical analysis knowledge sharing, funds flow analysis knowledge sharing, general skills-knowledge sharing and opinions sharing. The contents of this blog are not to be taken as investment advice or inducement to trade, and I take no responsibility for any gains or losses as a result of reading my analyses, judgements and opinions. In essence, practise due diligence. 

Hibiscus Petroleum (KLSE: 5199): 29 December 2019, Sunday

Hibiscus Petroleum (KLSE: 5199): 
29 December 2019, Sunday
(Click on Technical Chart above to Expand)

Attached is the Updated Technicals for Hibiscus Petroleum (KLSE: 5199) that is listed in the KLSE. The stock has broken out of its intra-day critical resistance that was formed over a long period of time within the hourly chart, and is turning critical resistances into critical supports (refer to blue arrowed technicals). Golden Cross has also been executed, with price actions having the ability to consolidate above golden cross. This is bullish in nature. Note that in the long term Technicals of Hibiscus Petroleum, it has the ability to break up of 2.68 pivotal resistance set in 2013 and rally beyond 3.00 psychological resistance. This will be in line with crude oil's bullish cycle (target US$180 per barrel) as reiterated in the past few years. Current price is 0.95, and a move beyond 3.00 would represent multi-bagger gain for investors and longs traders, and an expected +1000% gain to my price entry of below 0.30 (refer to past track records).

The Donovan Norfolk Technical Rating:
Bullish

DISCLAIMER
This analysis site, as well as the analyses in it, is created for the sole purpose of education, discussion, fundamental analysis knowledge sharing, technical analysis knowledge sharing, funds flow analysis knowledge sharing, general skills-knowledge sharing and opinions sharing. The contents of this blog are not to be taken as investment advice or inducement to trade, and I take no responsibility for any gains or losses as a result of reading my analyses, judgements and opinions. In essence, practise due diligence. 

Friday 20 December 2019

Dow Jones Industrial Average (DJIA): 20 December 2019


Daily Chart of Dow Jones Industrial Average (DJIA): 
20 December 2019
(Click on Technical Chart above to Expand)


Attached is the Dow Jones Industrial Average (DJIA) updated technicals which refuse to go down even on any bad news. Market has proven me wrong. Market-makers seem to be in full control. Hence, I am cutting losses on trying to trade a fake break-up since the break-up of the US markets' critical resistances have been proven real (no bad news can shake the break). I am wrong this time in trying to outsmart the market. I am bullish of US markets and the rest of the world, however I remain bearish on Hong Kong market. Today marks a confirmation day for US strength on the breakup of such highly critical resistance.

DISCLAIMER
This analysis site, as well as the analyses in it, is created for the sole purpose of education, discussion, fundamental analysis knowledge sharing, technical analysis knowledge sharing, funds flow analysis knowledge sharing, general skills-knowledge sharing and opinions sharing. The contents of this blog are not to be taken as investment advice or inducement to trade, and I take no responsibility for any gains or losses as a result of reading my analyses, judgements and opinions. In essence, practise due diligence. 

Tuesday 17 December 2019

The Hong Kong Hang Seng Index (HSI): 17 December 2019, Tuesday


The Hong Kong Hang Seng Index (HSI): 
17 December 2019, Tuesday
(Click on Technical Chart above to Expand)

Attached is the Hong Kong Hang Seng Index (HSI) which is now a short-sellers' shorting/selling market as demonstrated by my MATRIX recently. Hong Kong is now at red circled high pressure selling zone now. Main wave for Hong Kong remains down and escape waves remain small for chalking up of more shorts against Hang Seng Index and Hong Kong stocks (refer to technical chart).

DISCLAIMER
This analysis site, as well as the analyses in it, is created for the sole purpose of education, discussion, fundamental analysis knowledge sharing, technical analysis knowledge sharing, funds flow analysis knowledge sharing, general skills-knowledge sharing and opinions sharing. The contents of this blog are not to be taken as investment advice or inducement to trade, and I take no responsibility for any gains or losses as a result of reading my analyses, judgements and opinions. In essence, practise due diligence. 

Tuesday 3 December 2019

The Hong Kong Hang Seng Index (HSI): 3 December 2019, Tuesday


The Hong Kong Hang Seng Index (HSI): 
3 December 2019, Tuesday
(Click on Technical Chart above to Expand)


Attached is the Hong Kong Hang Seng Index (HSI) which is now a short-sellers' shorting/selling market as demonstrated by my MATRIX recently. The blue circled technical regions are where deliberate suppressions occur. The yellow circled regions show where the triple backtests of resistance-layer for Hang Seng Index had been successful. Collectively, the 5 circled yellow regions show the transition from buyers' market into sellers'/short-sellers' market in a merciful ranging for getting out of HK. The mercy is ending soon. Hong Kong's grand slam down is coming.  

DISCLAIMER
This analysis site, as well as the analyses in it, is created for the sole purpose of education, discussion, fundamental analysis knowledge sharing, technical analysis knowledge sharing, funds flow analysis knowledge sharing, general skills-knowledge sharing and opinions sharing. The contents of this blog are not to be taken as investment advice or inducement to trade, and I take no responsibility for any gains or losses as a result of reading my analyses, judgements and opinions. In essence, practise due diligence. 

The S&P 500 Index: 3 December 2019, Tuesday

The S&P 500 Index: 
3 December 2019, Tuesday
(Click on Technical Chart above to Expand)


Attached is the updated Technicals for The S&P 500 Index. Red Technicals and Black Technicals reflect selling is coming. Greed level among the herd worldwide is exceptionally high now. US markets have weakness now. Trump's election period may be Wall Streets' sychronised giving of face-throwing party for Trump. Protect or hedge yourself with more Gold/Gold ETFs. I am expecting Gold $1600 a guarantee, beyond $2000 a 99% probability and $2500-$3000 a 75% probability.

DISCLAIMER
This analysis site, as well as the analyses in it, is created for the sole purpose of education, discussion, fundamental analysis knowledge sharing, technical analysis knowledge sharing, funds flow analysis knowledge sharing, general skills-knowledge sharing and opinions sharing. The contents of this blog are not to be taken as investment advice or inducement to trade, and I take no responsibility for any gains or losses as a result of reading my analyses, judgements and opinions. In essence, practise due diligence. 

Wednesday 27 November 2019

Hong Kong Hang Seng Index: 27 November 2019, Wednesday


Hong Kong Hang Seng Index: 
27 November 2019, Wednesday
(Click on Technical Chart above to Expand)

Attached is the Hong Kong Hang Seng Index (HSI) Matrix.
Hong Kong market is playing the resistance matrix, i.e. the sellers' market.
Bearish.

DISCLAIMER
This analysis site, as well as the analyses in it, is created for the sole purpose of education, discussion, fundamental analysis knowledge sharing, technical analysis knowledge sharing, funds flow analysis knowledge sharing, general skills-knowledge sharing and opinions sharing. The contents of this blog are not to be taken as investment advice or inducement to trade, and I take no responsibility for any gains or losses as a result of reading my analyses, judgements and opinions. In essence, practise due diligence. 

Thursday 21 November 2019

China SSEC Index: 21 November 2019, Thursday

China SSEC Index: 
21 November 2019, Thursday
(Click on Technical Chart above to Expand)


Attached is the Updated Technicals for the China SSEC Index.
Market herd is at rapacious level. So if I am smart money, I will eat up the rapacious herd short term in one unexpected swoop, especially those who had been buying China markets thinking that trade war is over with the US-China phase 1 trade deal. This means a repeated pattern as boxed up may be in the brewing, and certain safety precautions such as reducing weight on portfolio, shorting weak stocks like Expedia, tourism stocks and downtrend stocks, and loading up of gold may be necessary as a form of hedge on one's portfolio of investments.

DISCLAIMER
This analysis site, as well as the analyses in it, is created for the sole purpose of education, discussion, fundamental analysis knowledge sharing, technical analysis knowledge sharing, funds flow analysis knowledge sharing, general skills-knowledge sharing and opinions sharing. The contents of this blog are not to be taken as investment advice or inducement to trade, and I take no responsibility for any gains or losses as a result of reading my analyses, judgements and opinions. In essence, practise due diligence. 

Wednesday 20 November 2019

Updated Technicals on Gold: 20 November 2019, Wednesday


Updated Technicals on Gold:
20 November 2019, Wednesday
(Click on the Technical Chart Above to Expand)

Attached is the Updated Technicals on Gold. This has extremely important implication for all Gold Stocks, SPDR Gold ETFs, Gold Miners and anything related to precious metals. The 2 orange circled zones are zones of massive re-accumulation. The dy/dx = z of the first breakup resulted in where we are now (dark black parallel trajectories). Gold is preparing for next major upwave which will hit a target of guaranteed $1850 per ounce (refer technicals and study in detail). This upmove will be a repeated pattern except that it will be sharper with a dy/dx = w. The gradient w will bring Gold to a measured $1850 in this immediate wave (my longer term wave is a guaranteed >$2000 an ounce). The blue zone is where the dy/dx = z is extremely close to completion brewing for next dy/dx = w that will bring Gold to $1850.

The Donovan Norfolk Technical Rating:
Bullish short term, mid term and long term -- all 3 time frames.


DISCLAIMER

This analysis site, as well as the analyses in it, is created for the sole purpose of education, discussion, fundamental analysis knowledge sharing, technical analysis knowledge sharing, funds flow analysis knowledge sharing, general skills-knowledge sharing and opinions sharing. The contents of this blog are not to be taken as investment advice or inducement to trade, and I take no responsibility for any gains or losses as a result of reading my analyses, judgements and opinions. In essence, practise due diligence. 

VIX Fear Index: 20 November 2019, Wednesday

VIX Fear Index: 
20 November 2019, Wednesday
(Click on Technical Chart above to Expand)

Attached is the Updated Technicals for the VIX Fear Index.
Short term fear is coming to the financial markets.


DISCLAIMER
This analysis site, as well as the analyses in it, is created for the sole purpose of education, discussion, fundamental analysis knowledge sharing, technical analysis knowledge sharing, funds flow analysis knowledge sharing, general skills-knowledge sharing and opinions sharing. The contents of this blog are not to be taken as investment advice or inducement to trade, and I take no responsibility for any gains or losses as a result of reading my analyses, judgements and opinions. In essence, practise due diligence. 

Monday 18 November 2019

Hang Seng Index: 18 November 2019, Monday

Hang Seng Index: 
18 November 2019, Monday
(Click on Technical Chart above to Expand)

Attached is the Updated Technicals for the Hong Kong Hang Seng Index.
Three elegant technical lines sum up everything.

The Donovan Norfolk Technical Rating for Hong Kong:

Bearish

DISCLAIMER
This analysis site, as well as the analyses in it, is created for the sole purpose of education, discussion, fundamental analysis knowledge sharing, technical analysis knowledge sharing, funds flow analysis knowledge sharing, general skills-knowledge sharing and opinions sharing. The contents of this blog are not to be taken as investment advice or inducement to trade, and I take no responsibility for any gains or losses as a result of reading my analyses, judgements and opinions. In essence, practise due diligence. 

JAKS Resources (KLSE: 4723): 18 November 2019

JAKS Resources (KLSE: 4723):
18 November 2019
(Click on the Technical Chart Above to Expand)

Attached is the updated Technicals on JAKS Resources (KLSE: 4723).
It has formed a massive accumulation and re-accumulation of TRIPLE BOTTOM / INVERSE SHOULDER-HEADER-SHOULDER. The accumulation and re-accumulation is done by extreme shakeout of weak holders (characteristics of triple bottom and inverse shoulder-head-shoulder). Based on technical price structure, the projected price action is illustrated in black. Resistances will break and supports will hold.
Bullish Biased on this power supply utility company

DISCLAIMER
This analysis site, as well as the analyses in it, is created for the sole purpose of education, discussion, fundamental analysis knowledge sharing, technical analysis knowledge sharing, funds flow analysis knowledge sharing, general skills-knowledge sharing and opinions sharing. The contents of this blog are not to be taken as investment advice or inducement to trade, and I take no responsibility for any gains or losses as a result of reading my analyses, judgements and opinions. In essence, practise due diligence. 

Tuesday 12 November 2019

The Hong Kong Hang Seng Index: 12 Nov 2019, Tuesday

The Hong Kong Hang Seng Index: 
12 Nov 2019, Tuesday
(Click on Technical Chart above to Expand)

Attached is the Updated Technicals for the Hong Kong Hang Seng Index.
Short Hang Seng Index on every intraday rebounds, supports will not hold anymore. HSI is currently doing backtests and confirmations of resistances. Resistances will hold and supports will break for Hang Seng Index (See Technicals Attached).

The Donovan Norfolk Technical Rating for Hong Kong:
Bearish

DISCLAIMER
This analysis site, as well as the analyses in it, is created for the sole purpose of education, discussion, fundamental analysis knowledge sharing, technical analysis knowledge sharing, funds flow analysis knowledge sharing, general skills-knowledge sharing and opinions sharing. The contents of this blog are not to be taken as investment advice or inducement to trade, and I take no responsibility for any gains or losses as a result of reading my analyses, judgements and opinions. In essence, practise due diligence. 

Sunday 10 November 2019

S&P 500 Index: 10 November 2019, Sunday

S&P 500 Index: 
10 November 2019, Sunday
(Click on Technical Chart above to Expand)
Attached is the Technicals for S&P 500. It has hit major resistance.
I expect correction coming. I do not expect the inverse shoulder-head-shoulder to break up.


DISCLAIMER
This analysis site, as well as the analyses in it, is created for the sole purpose of education, discussion, fundamental analysis knowledge sharing, technical analysis knowledge sharing, funds flow analysis knowledge sharing, general skills-knowledge sharing and opinions sharing. The contents of this blog are not to be taken as investment advice or inducement to trade, and I take no responsibility for any gains or losses as a result of reading my analyses, judgements and opinions. In essence, practise due diligence. 

Deutsche Bank (NYSE: DB): 10 November 2019, Sunday


Deutsche Bank (NYSE: DB): 
10 November 2019, Sunday
(Click on Technical Chart above to Expand)

Attached is the Technicals for Deutsche Bank.
Will Deutsche Bank collapse, go belly up and trigger systemic financial crisis of a tsunami scale?
The answer lies in how worldwide market has been trading the shares of the bank. Attached is the technicals and volume analysis (volume flow) of how the market has been trading Deutsche Bank. Study in detail for insights could be gained from this.


The Donovan Norfolk Technical Rating for Ford:
 No Rating 

DISCLAIMER
This analysis site, as well as the analyses in it, is created for the sole purpose of education, discussion, fundamental analysis knowledge sharing, technical analysis knowledge sharing, funds flow analysis knowledge sharing, general skills-knowledge sharing and opinions sharing. The contents of this blog are not to be taken as investment advice or inducement to trade, and I take no responsibility for any gains or losses as a result of reading my analyses, judgements and opinions. In essence, practise due diligence. 

Thursday 7 November 2019

Ford (NYSE: F): 7 November 2019, Thursday, 12.58am Singapore Time (6 Nov US Time)


Ford (NYSE: F): 
7 November 2019, Thursday, 12.58am Singapore Time (6 Nov US Time)
(Click on Technical Chart above to Expand)
Attached is the Technicals for Ford. Observe the technicals in detail, in particular paying attention to my red band, brown band and black band of resistances suppressing Ford. Ford will continue to be shorted down and be hammered down as illustrated by the red trajectory. The SCTR is deteriorating to the point of F for Ford. The resistances that are acting on the current price action means heavy selling is expected to come for Ford because these resistances are significantly bearish resistances of high selling pressure.

The Donovan Norfolk Technical Rating for Ford:
 Bearish (Short/Sell)

DISCLAIMER
This analysis site, as well as the analyses in it, is created for the sole purpose of education, discussion, fundamental analysis knowledge sharing, technical analysis knowledge sharing, funds flow analysis knowledge sharing, general skills-knowledge sharing and opinions sharing. The contents of this blog are not to be taken as investment advice or inducement to trade, and I take no responsibility for any gains or losses as a result of reading my analyses, judgements and opinions. In essence, practise due diligence. 

Sunday 3 November 2019

Updated Technicals on Gold: 3 November 2019, Sunday


Updated Technicals on Gold:
3 November 2019, Sunday
(Click on the Technical Chart Above to Expand)

Attached is the Updated Technicals on Gold ETF which is pegged to Gold Spot Prices. Gold ETFs have undergone bullish flag pole coupled with bullish flag pole volumes. Further to that it has completed the corresponding bull flag consolidation in drying volumes (meaning upmove sustainable, weak holders shaken out), and has broken out for more flag pole upmove as illustrated. The flag pole measurements are proportional in 1x to 1x ratio. The SCTR strong maintenance while consolidation done in MACD means the bullishness in Gold is an ass-kicking strong one.

The Donovan Norfolk Technical Rating:
Bullish immediate term, short term, mid term and long term -- all 4 time frames.


DISCLAIMER

This analysis site, as well as the analyses in it, is created for the sole purpose of education, discussion, fundamental analysis knowledge sharing, technical analysis knowledge sharing, funds flow analysis knowledge sharing, general skills-knowledge sharing and opinions sharing. The contents of this blog are not to be taken as investment advice or inducement to trade, and I take no responsibility for any gains or losses as a result of reading my analyses, judgements and opinions. In essence, practise due diligence. 

Thursday 31 October 2019

The Hong Kong Hang Seng Index: 31 October 2019, Thursday


The Hong Kong Hang Seng Index: 
31 October 2019, Thursday
(Click on Technical Chart above to Expand)

Attached is the Updated Technicals for the Hong Kong Hang Seng Index. Observe the technicals in detail, in particular paying attention to the red trend band, black trend band and the green trend band. The Hong Kong market has now turned into a short-selling market as illustrated on technical chart attached. The red trend band and the purple trend band are powerful resistances which will hold. This means Hong Kong and Hang Seng Index will go down as shown in the projected trajectory. Hong Kong is the weakest market in the world right now. Its worst is far from over. If green trend band breaks down, the black trend band support within the black channel is a capitulation zone of maximum fear for Hong Kong.

The Donovan Norfolk Technical Rating for Hong Kong:
Significantly Bearish

DISCLAIMER
This analysis site, as well as the analyses in it, is created for the sole purpose of education, discussion, fundamental analysis knowledge sharing, technical analysis knowledge sharing, funds flow analysis knowledge sharing, general skills-knowledge sharing and opinions sharing. The contents of this blog are not to be taken as investment advice or inducement to trade, and I take no responsibility for any gains or losses as a result of reading my analyses, judgements and opinions. In essence, practise due diligence. 

Thursday 24 October 2019

Google-Alphabet (NASDAQ: GOOGL): 24 October 2019, Thursday

Google-Alphabet (NASDAQ: GOOGL):
24 October 2019, Thursday
(Click on the Technical Chart Above to Expand)

Attached is the updated Technicals on Google-Alphabet (NASDAQ: GOOGL).
It has formed a decently significant bullish ascending triangle of accumulation. This is a one-year's worth of strong re-accumulation. The next target upwards will be around $1600, making the upside significant as well. The ascending triangle can also be viewed as a bullish cup and handle. Refer to the projection X based on a current cup and handle as illustrated.

The Donovan Norfolk Technical Rating:
Bullish Biased

DISCLAIMER
This analysis site, as well as the analyses in it, is created for the sole purpose of education, discussion, fundamental analysis knowledge sharing, technical analysis knowledge sharing, funds flow analysis knowledge sharing, general skills-knowledge sharing and opinions sharing. The contents of this blog are not to be taken as investment advice or inducement to trade, and I take no responsibility for any gains or losses as a result of reading my analyses, judgements and opinions. In essence, practise due diligence. 

Apple (NASDAQ: AAPL): 24 October 2019, Thursday

Apple (NASDAQ: AAPL):
24 October 2019, Thursday
(Click on the Technical Chart Above to Expand)

Attached is the updated Technicals on Apple Inc (NASDAQ: AAPL).
It has indeed further rallied for more critical breakups per forewarned earlier based on funds flow and technicals. Based current price structure (refer to X projection on technicals), Apple's immediate target is $325-$350 now, representing lucrative upside.

The Donovan Norfolk Technical Rating:
Bullish Biased

DISCLAIMER
This analysis site, as well as the analyses in it, is created for the sole purpose of education, discussion, fundamental analysis knowledge sharing, technical analysis knowledge sharing, funds flow analysis knowledge sharing, general skills-knowledge sharing and opinions sharing. The contents of this blog are not to be taken as investment advice or inducement to trade, and I take no responsibility for any gains or losses as a result of reading my analyses, judgements and opinions. In essence, practise due diligence. 

Wednesday 23 October 2019

Updated Multi-frame Technicals on Gold: 23 October 2019, 10.22pm Singapore Time


Updated Multi-frame Technicals on Gold:
23 October 2019, 10.22pm Singapore Time
(Click on the Technical Chart Above to Expand)

Attached is the Updated Gold Multi-frame Technicals on Gold. On the 15 minute chart, gold is supported with deliberate efforts by the market smart monies: Bullish. On the Hourly Chart, it has just achieved critical breakup and had done its critical backtest: Bullish. On the 4-Hourly Chart, it is undergoing the critical longer time framed breakout for a large move up in the 4H Timeframe. In the Daily Chart, it shows Gold backtesting the long term support band of moving averages using a bullish rounding technical price structure which means deliberate re-accumulation and that the large move up for Gold would be highly reliable. Gold is ready for next wave up to the guaranteed $1550-$1600 band. When this band is made support, a break up above $2000 is guaranteed as well.

The Donovan Norfolk Technical Rating:
Bullish immediate term, short term, mid term and long term -- all 4 time frames.


DISCLAIMER

This analysis site, as well as the analyses in it, is created for the sole purpose of education, discussion, fundamental analysis knowledge sharing, technical analysis knowledge sharing, funds flow analysis knowledge sharing, general skills-knowledge sharing and opinions sharing. The contents of this blog are not to be taken as investment advice or inducement to trade, and I take no responsibility for any gains or losses as a result of reading my analyses, judgements and opinions. In essence, practise due diligence. 

Monday 21 October 2019

Keppel Corporation (SGX: BN4): 21 October 2019, Monday

Keppel Corporation (SGX: BN4):
21 October 2019, Monday
(Click on the Technical Chart Above to Expand)

Attached is the updated Technicals on Keppel Corporation (SGX: BN4), the largest oil rig builder in the world and now a multi-industry conglomerate. The blue channel is the Secular Trend Major Uptrend Channel. The series of red and green circled regions made up the blue channel. The mid channel is demarcated by the orange circled zones of price action. The blue channel is a highly reliable one due to the price actions. The pink illustrated price actions show where the inverse-bump-run occurred. Inverse bump-run in technical price structure is a strongly accumulative price action, i.e. accumulation/buy on the stocks by the smarter monies when herd are out. The expected trajectory in black will likely send Keppel Corp to all time highs never seen before in the current secular cycle.

The Donovan Norfolk Technical Rating:
Bullish Biased

DISCLAIMER
This analysis site, as well as the analyses in it, is created for the sole purpose of education, discussion, fundamental analysis knowledge sharing, technical analysis knowledge sharing, funds flow analysis knowledge sharing, general skills-knowledge sharing and opinions sharing. The contents of this blog are not to be taken as investment advice or inducement to trade, and I take no responsibility for any gains or losses as a result of reading my analyses, judgements and opinions. In essence, practise due diligence. 

Friday 18 October 2019

Apple (NASDAQ: AAPL): 18 October 2019, Friday

Apple (NASDAQ: AAPL):
18 October 2019, Friday
(Click on the Technical Chart Above to Expand)

Attached is the updated Technicals on Apple Inc (NASDAQ: AAPL).
As promised in my past analysis that Apple will super rally, it has just broken up yet another critical resistance as illustrated. The upside is significant and is measured by the projection X as shown. It will easily hit above $275 per share. Bullish biased.

The Donovan Norfolk Technical Rating:
Highly Bullish Biased

DISCLAIMER
This analysis site, as well as the analyses in it, is created for the sole purpose of education, discussion, fundamental analysis knowledge sharing, technical analysis knowledge sharing, funds flow analysis knowledge sharing, general skills-knowledge sharing and opinions sharing. The contents of this blog are not to be taken as investment advice or inducement to trade, and I take no responsibility for any gains or losses as a result of reading my analyses, judgements and opinions. In essence, practise due diligence. 

Tuesday 15 October 2019

Technicals of iShares MSCI Emerging Markets (AMEX: EEM): 15 October 2019, Tuesday

Technicals of iShares MSCI Emerging Markets (AMEX: EEM):
15 October 2019, Tuesday
(Click on the Technical Chart Above to Expand)

Attached is the Technicals of iShares MSCI Emerging Markets ETF (AMEX: EEM). It is completing its large and bullish cup-and-handle soon. A large scale cup-and-handle brews for a large scale upmove. Expect hot monies to flow back to Emerging Markets and Asian Markets in 4Q-2019 and whole of 2020. The orange trajectory is the projected trajectory. The volume as illustrated is the decreasing volume of accumulation and selling is dry already. The markets are bullish against widespread belief. Year 2019 trade war was used as a massive re-accumulation, contrary to the herd's actions and expectations.

The Donovan Norfolk Technical Rating:
Bullish

DISCLAIMER

This analysis site, as well as the analyses in it, is created for the sole purpose of education, discussion, fundamental analysis knowledge sharing, technical analysis knowledge sharing, funds flow analysis knowledge sharing, general skills-knowledge sharing and opinions sharing. The contents of this blog are not to be taken as investment advice or inducement to trade, and I take no responsibility for any gains or losses as a result of reading my analyses, judgements and opinions. In essence, practise due diligence. 

Friday 11 October 2019

Technicals of VISA (NYSE: V): 11 October 2019, Friday


Technicals of VISA (NYSE: V):
11 October 2019, Friday
(Click on the Technical Chart Above to Expand)

Attached is the Technicals of VISA (NYSE: V). Momentum on VISA has been flipped to upmove momentum. Also this move up is the resumption of the next big move up. If you observe all the circled regions within the technical chart, you will realise that the internal lines of the channel are all abided and respect by the market, in turn making the channel a very powerful channel. This means that VISA is ready for the next big wave up from current support. The bullish expanding triangle is a highly bullish expanding triangle, for sharp and big move up. Bullish on VISA.

The Donovan Norfolk Technical Rating:
High Bullish

DISCLAIMER

This analysis site, as well as the analyses in it, is created for the sole purpose of education, discussion, fundamental analysis knowledge sharing, technical analysis knowledge sharing, funds flow analysis knowledge sharing, general skills-knowledge sharing and opinions sharing. The contents of this blog are not to be taken as investment advice or inducement to trade, and I take no responsibility for any gains or losses as a result of reading my analyses, judgements and opinions. In essence, practise due diligence. 

Monday 30 September 2019

Technicals of Breadtalk (SGX: CTN): 30 September 2019, Monday

Technicals of Breadtalk (SGX: CTN):
30 September 2019, Monday
(Click on the Technical Chart Above to Expand)

Attached is the latest Technicals on Breadtalk (SGX: CTN). It is listed in the Singapore SGX. The black trend lines make up the uptrend channel lines. The grey lines make up the internal lines within the channel. Breadtalk executed a fake breakup as illustrated by the first red circled region and is bearish in nature. This is followed by a breakdown of the uptrend channel suggesting a new downtrend for breaktalk unless it is able to reclaim lost ground and goes back up into the channel. A fake breakup followed by a real breakdown is often HIGHLY BEARISH in nature. Bearish on Breadtalk now. Any rebound is an exit for breaktalk based on technicals.


DISCLAIMER

This analysis site, as well as the analyses in it, is created for the sole purpose of education, discussion, fundamental analysis knowledge sharing, technical analysis knowledge sharing, funds flow analysis knowledge sharing, general skills-knowledge sharing and opinions sharing. The contents of this blog are not to be taken as investment advice or inducement to trade, and I take no responsibility for any gains or losses as a result of reading my analyses, judgements and opinions. In essence, practise due diligence. 

Cryptocurrency Litecoin: 30 September 2019, Monday


Cryptocurrency Litecoin: 
30 September 2019, Monday
(Click on Technical Chart above to Expand)

Attached is the Technicals for the Litecoin Cryptocurrency -- yet another Cryptocurrency in high bearish state right now suggesting the end for cryptocurrencies. This is in tune with smart monies shorting cryptocurrencies per funds flow theory. This is in tune with all important Market-Makers not obstructing big monies, per funds flow theory too. Taken as aggregate, this explains why Cryptocurrencies' plunge had been so smooth-sailing. This is in tune with my preempted bearish analysis on bitcoins when bitcoins were above $10,000. Now bitcoins have plunged more than -20% to below $8000 in 1.5 weeks after my forewarning. The Litecoin red circled region executed recently is a confirmation of the huge resistance backtest confirmation in orange. The projection down is illustrated by grey arrows. Highly Bearish.


DISCLAIMER
This analysis site, as well as the analyses in it, is created for the sole purpose of education, discussion, fundamental analysis knowledge sharing, technical analysis knowledge sharing, funds flow analysis knowledge sharing, general skills-knowledge sharing and opinions sharing. The contents of this blog are not to be taken as investment advice or inducement to trade, and I take no responsibility for any gains or losses as a result of reading my analyses, judgements and opinions. In essence, practise due diligence. 

Wednesday 25 September 2019

Cryptocurrency Ripple: 25 September 2019, Wednesday

Cryptocurrency Ripple: 
25 September 2019, Wednesday
(Click on Technical Chart above to Expand)

Attached is the Technicals for the Ripple Cryptocurrency. The red circled region is where fake breakup occurred in low volume, easily going up, and thereafter lured in large amount of buy queues all over the world, and then getting dumped with short-sells with high volumes when the buy queues came in from the herd after the fake bullish break-ups. The blue circled region is where real breakdown occurred soon after the fake break-up. Collectively, this entire technical set-up is very bearish in nature. There were so many retailers and high volume of herd buying cryptocurrencies in the past 1-2 months, and when they do, the missile is locked in on them, the boat rocks, then sinks, then drowns.


DISCLAIMER
This analysis site, as well as the analyses in it, is created for the sole purpose of education, discussion, fundamental analysis knowledge sharing, technical analysis knowledge sharing, funds flow analysis knowledge sharing, general skills-knowledge sharing and opinions sharing. The contents of this blog are not to be taken as investment advice or inducement to trade, and I take no responsibility for any gains or losses as a result of reading my analyses, judgements and opinions. In essence, practise due diligence. 

Sunday 22 September 2019

Bitcoins: 22 September 2019, Sunday


Bitcoins: 
22 September 2019, Sunday
(Click on Technical Chart above to Expand)

Attached is the Updated Technicals for the Bitcoins. The bitcoins' large descending triangle of distribution is line with the smart monies' bearish funds flow set up which I had forewarned even before the distributional (selling) triangle was set up. The triangle has finally been formed, true to my words. Bitcoins have now broken down the $10,000 psychological support, turning the $10k psychological support into a psychological resistance now. There is also persistent red selling ashi in the candles.


DISCLAIMER
This analysis site, as well as the analyses in it, is created for the sole purpose of education, discussion, fundamental analysis knowledge sharing, technical analysis knowledge sharing, funds flow analysis knowledge sharing, general skills-knowledge sharing and opinions sharing. The contents of this blog are not to be taken as investment advice or inducement to trade, and I take no responsibility for any gains or losses as a result of reading my analyses, judgements and opinions. In essence, practise due diligence. 

Thursday 5 September 2019

The Hong Kong Hang Seng Index: 5 September 2019, Thursday

The Hong Kong Hang Seng Index: 
5 September 2019, Thursday
(Click on Technical Chart above to Expand)

Attached is the Updated Technicals for the Hong Kong Hang Seng Index. While most of the naive herd was confidently shorting away and bearish with conviction because they witnessed the brunt of the protests, the burning petrol bombs and the violence, the markets were operating against the majority busy absorbing the sells and shorts. It was in tune with my analyses that one should not look to short nor be bearish because the markets are often not WYSIWYG. Instead the markets engaged in massive re-accumulation as illustrated by the large ascending triangle in light orange and red. The ascending triangle has been broken upwards and is doing backtest of the resistance-turned-support currently at 26226-26429 points. The momentum in blue is the set-up brewed to wipe out the shorts. Bullish. For instance, as analysed earlier, China Taiping Insurance was already showing strong signs and was already a buy.


DISCLAIMER
This analysis site, as well as the analyses in it, is created for the sole purpose of education, discussion, fundamental analysis knowledge sharing, technical analysis knowledge sharing, funds flow analysis knowledge sharing, general skills-knowledge sharing and opinions sharing. The contents of this blog are not to be taken as investment advice or inducement to trade, and I take no responsibility for any gains or losses as a result of reading my analyses, judgements and opinions. In essence, practise due diligence. 

Friday 30 August 2019

Bitcoins: 30 August 2019, Friday

Bitcoins: 
30 August 2019, Friday
(Click on Technical Chart above to Expand)
Attached is the Updated Technical for Bitcoins. Bitcoins have now proven that my previous conjecture was wrong. Cryptocurrency shorts out there are really strong. It is a trade in which I have to face reality to the smart money positionings. It is a trade which I must admit I was wrong in ignoring the funds flow of smart monies and that I should not had been bullish in it. I must admit my mistake and that I should not had broken my own rules. I am back to bearishness in cryptocurrencies such as Bitcoins (the mother of all cryptocurrencies) now. In fact, I am high bearishness in Bitcoins and Cryptos now. I expect the big distributional neckline at 9081-9654 (in red) to break down now. I am sorry that I was wrong and now I must face up to facts -- that bitcoins and cryptocurrencies are not bullish.

Donovan Norfolk Technical View:
Flip back to Bearishness in Bitcoins and Cryptocurrencies

DISCLAIMER
This analysis site, as well as the analyses in it, is created for the sole purpose of education, discussion, fundamental analysis knowledge sharing, technical analysis knowledge sharing, funds flow analysis knowledge sharing, general skills-knowledge sharing and opinions sharing. The contents of this blog are not to be taken as investment advice or inducement to trade, and I take no responsibility for any gains or losses as a result of reading my analyses, judgements and opinions. In essence, practise due diligence.