Ticker 1

Ticker 2

Click "Like" to Receive First Hand Updates From The Analysis Site / Click "SHARE" to share

Sunday, 22 July 2018

MAYBANK (KLSE: 1155): 22 July 2018, Sunday, 11.10am Singapore Time

MAYBANK (KLSE: 1155): 
22 July 2018, Sunday, 11.10am Singapore Time
(Click on Technical Chart above to Expand)

Attached is the updated Technicals for MAYBANK -- The Donovan Norfolk Rated Top Bank of Entire Malaysia KLSE. The 3 dark green circled regions are my live calls in January 2016, 1H-2016 and 2H-2016 to buy bank stocks all over the world. Back in 2016, the herd were shouting for market crash and a bear market because the FED rate hikes caused a massive fear and markets were selling off. Singapore was to have technical recession back in 2016 too, and I was calling for bank stocks' buys. 

Most of the followers are now sitting on more than +50% profits for Maybank and their profits will blossom into +100% in the coming resumption of world bank stocks' super rally (see cross reference link attached at the bottom of this analysis).

The first yellow trajectory measures $3.80 on linear scale and +55% on logarithmic scale. This means the next wave of banks' super rally worldwide will bring Maybank to $12.40 conservative target on the linear scale, and $13.33 logarithmic target on the logarithmic scale. MayBank may then rest slightly and proceed for probing of prices beyond $13.33 in the secular bull market.

Reiterate:
MayBank is Ranked the Number 1 Top Bank  of Malaysia by The Donovan Norfolk

Side Note:
At target of $13.33, many of these early fans of Donovan Norfolk will have returns of more than +100% profits on such quality stocks. 

Additional Note:
Worldwide bank stocks are expected to shoot through the roof in 2H-2018 and 2019. More waves of super rally in equity markets can be expected in 2H-2018, 1H-2019 and 2H-2019 -- amidst the backdrop of 80% market majority having the conviction of a bear market coming.

Important Cross-Reference:
http://donovan-ang.blogspot.com/2018/07/spdr-financial-select-sector-index.html


Saturday, 21 July 2018

Development Bank of Singapore (DBS): 21 July 2018, Saturday, 2.53pm Singapore Time

Development Bank of Singapore (DBS): 
21 July 2018, Saturday, 2.53pm Singapore Time
(Click on Technical Chart above to Expand)

Attached is the updated Technicals for Development Bank of Singapore -- The Donovan Norfolk Rated Top Stock of Entire Singapore SGX. The 3 dark green circled regions are my live calls in January 2016 to buy bank stocks all over the world, especially DBS Bank stocks. Singapore was to have technical recession back in 2016, 90% herd were selling cheaply at $12, calling me ridiculous to buy on bear market and forgotten my track records back then; only my fans and followers were buying. 

The double light green classical supports are the points of +100% profits for my early fans and followers who bought at $12.00-$13.00. They are sitting on +100% profits with 8%-10% dividend yields per annum. The smart monies are protecting these profits with the so many layers of supports as illustrated on chart, because DBS has fundamentals and is the top stock of entire Singapore SGX in my financial modelling.

The first green trajectory measures $10.50 on linear scale and +53% on logarithmic scale. This means the next wave of banks' super rally worldwide will bring DBS to $35.50 conservative target on the linear scale, and $38.00 logarithmic target on the logarithmic scale. DBS Bank may then rest slightly and proceed for $53.42 target using fundamentals-logic derived earlier. 

Reiterate:
DBS Bank is Ranked the Number 1 Top Stock of Donovan Norfolk for Entire Singapore SGX.

Side Note:
At target of $53.42, many of these early fans of Donovan Norfolk will have returns of +334% to +445% on DBS equities, with dividend yields of +8%-+10% per annum. Late fans of 2018 will still enjoy returns of +200% (+100% profits), with dividend yields of +4% per annum.

Additional Note:
Worldwide bank stocks are expected to shoot through the roof in 2H-2018 and 2019. More waves of super rally in equity markets can be expected in 2H-2018, 1H-2019 and 2H-2019 -- amidst the backdrop of 80% market majority having the conviction of a bear market coming.

Important Cross-Reference:
http://donovan-ang.blogspot.com/2018/07/spdr-financial-select-sector-index.html


Thursday, 19 July 2018

SPDR Financial Select Sector Index (Implications for Bank Stocks): 19 July 2018, Thursday, 9.45pm Singapore Time

SPDR Financial Select Sector Index (Implications for Bank Stocks): 
19 July 2018, Thursday, 9.45pm Singapore Time
(Click on Technical Chart above to Expand)


Attached is the Technicals for SPDR Financial Select Sector. It is an ETF, and it can be read as an index consisting of an indicative basket of banking and finance stocks representative of the sector.

The SPDR Financial Select Sector is a good litmus for US and Worldwide Bank Stocks (and Financial stocks). In addition, when banking sector and finance sector rally, stock markets worldwide typically rally as well, and the rallies will often spread to all other sectors.

SPDR Financial Select Sector has completed its Bullish Descending Wedge of large re-accumulation (Blue formation on chart). The Bullish Wedge here is also a Bull Pennant of a sizable scale. The wedge had yesterday achieved a critical breakout to the upside. The breakup was achieved at the 2/3 point of the triangular wedge, meaning it is a perfect breakout execution.

The 2nd green arrow is the expected trajectory and it is a pennant pole measuring x in distance, mirroring the 1st pennant pole (measured x in distance) as illustrated by the 1st green arrow.

It is worth highlighting that the US Trade War was used to shake out fools aplenty in the financial markets. These herding sheeps are very bearish and are calling for either stock market crash or a bear market. The predatory smart monies deem it right to execute bullish breakup of the wedge-pennant now -- to leave behind the herd-majority who are out. This will leave many people behind and turn short-sellers into a charred state.

The Donovan Norfolk Technical Rating:
Worldwide bank stocks are expected to shoot through the roof in 2H-2018 and 2019. More waves of super rally in equity markets can be expected in 2H-2018, 1H-2019 and 2H-2019 -- amidst the backdrop of 80% market majority having the conviction of a bear market coming.


WCT Holdings (KLSE: 9679): 19 July 2018, Thursday, 3.41pm Singapore Time


WCT Holdings (KLSE: 9679): 
19 July 2018, Thursday, 3.41pm Singapore Time
(Click on Technical Chart above to Expand)

Attached is the Technicals of WCT Holdings that is listed in the KLSE (KLSE: 9679).
This stock has successfully sucked in many fools into buying. The herd is bullish based on my ground observation and sees this stock as a buy. However, the stock remains a strongly funds outflow stock. It is entrenched in strong downtrend. Sell on dead cat bounces for WCT which is having an escape wave. Rebounds are merely for confirming that the stock is in cancer stage. Successful backtest of gap-down region in red means successful confirmation of cancer. Buying means gambling as the risk is high. Instead one should be looking to short the stock at gap-down sell pressure region. Bearish for WCT.

FTSE Bursa Malaysia KLCI Index: 19 July 2018, Thursday, 1.20pm Singapore Time

FTSE Bursa Malaysia KLCI Index: 
19 July 2018, Thursday, 1.20pm Singapore Time
(Click on Technical Chart above to Expand)

Attached is the Malaysia KLCI Index. The series of red circled regions and green circled regions show how the markets in Malaysia had turned from an originally intended bear market to a complete new up-trending bull market -- turning long term resistance band at 1709-1732 points to long term support band.

The yellow circled regions are my live warnings in 2016 and 2017 to buy cheaply while market herd were calling for bear market and market crash on rate hikes. This was where I called for maximum bullishness and loaded up good stocks such as Hibiscus Petroleum in 2016 -- at a mere 26 cents as much as I could (http://donovan-ang.blogspot.com/2016/10/hibiscus-petroleum-20-october-2016.html), and also called for it to bottom with the indices and the crude oil market. Many smart followers followed my live buys and loaded at 26 cents, and at current price of 91.5cents, they are sitting on +350% returns. My expectation is +1000% in returns from the bull market for the stock, and it has another 750% journey to go, which is a triangulation of just how much legs the bull market will go (my forewarning is that 2008-2018 is merely 1st leg of bull market, while 2018-2028 is 2nd leg of bull market where majority of gains are to be made for 90% of all stocks across the board).

As previously fore-warned that the sell-off by foreign funds in Malaysia following the Pakatan Harapan election victory would just be backtests of supports and for confirming long term bull market for the upcoming 3 years, and that market herd will mostly be interpreting it as bear market, the market as well as the herd's mentality have been enacting too per my fore-warnings.

Smart monies have now confirmed that the backtests of supports are successful and will be flowing back into the markets in droves. Most of the herd are bearish and full of conviction of a bear market now. This is when the equity market will be executing the brown trajectory per my financial modelling. The time is ripe. In addition, we are now at the confluence of multiple supports as highlighted in light blue on chart. The treacherous backtests of supports have been completed.

From current point which is the mid-term, mid-point and mid-wave of Super-Cycle bull market (refer to all triangulations derived previously in all my live analyses),  we will be continuing the 2nd half of a wave 3 bull market (even wave 5 is far from current point). From current point, based on history, large caps typically have at least another 2x upside, mid caps have at least another 5x upside, and small caps have at least another 10x upside. Research past 50 years of data -- this is a standard economic cycle.


Creative Technology: 19 July 2018, Thursday, 9.40am Singapore Time

Creative Technology:
19 July 2018, Thursday, 9.40am Singapore Time
(Click on Technical Chart above to Expand)

Attached is the Technicals for Creative Technology that is listed in the Singapore SGX. Pole P measures from $1.20 to $10.00, hence: (1) height of pole P = $8.80 in absolute terms (linear chart); and (2) height of pole P = 8.333x in relative terms (logarithmic chart). Hence, Target of Creative Technology is:
 1. Estimated $6.80 + $8.80 = $15.60 in absolute terms (linear chart), representing more than 200% in returns (conservative)
2. Estimated $6.80 x 8.333 = $56.66 in relative terms (logarithmic chart), representing more than 850% in returns (aggressive).


Tuesday, 17 July 2018

Japanese Yen Basket (Index): 17 July 2018, Tuesday, 11.16pm Singapore Time

Japanese Yen Basket (Index):
17 July 2018, Tuesday, 11.16pm Singapore Time
(Click on Technical Chart above to Expand)

Attached is the technicals of the Japanese Yen Basket. The JPY has a bear pennant pole of around 6.00 in measurement (x = 6.00). It has broken down the Yen-Bear Pennant. The projected target down from the breakdown region of 90.00 yields 90.00-x = 84.00 as immediate target. The implication from all these is that with the breakdown of Yen for big JPY wave down, it means stocks-equities worldwide are bullish and ready for the next big wave up.

Intercontinental Exchange Group Inc (NYSE: ICE): 17 July 2018, Tuesday, 3.10pm Singapore Time

Intercontinental Exchange Group Inc (NYSE: ICE) 
17 July 2018, Tuesday, 3.10pm Singapore Time
(Click on Technical Chart above to Expand)

Attached is the Technicals for Intercontinental Exchange Group (ICE) that is listed in the US Market (NYSE: ICE). Intercontinental Exchange (ICE) is the owner of New York Stock Exchange (NYSE). As I expect the next large wave of bull market to resume soon --WITH EXPLOSIVELY HIGH VOLUMES for the next leg of bull market worldwide, I would expect ICE to spike up explosively as well. ICE is currently completing its huge Ascending Triangle of Re-accumulation soon (High Bullishness). Measuring the height of the triangle yields x = $10.00. From breakout at $75.00, immediate target upon breakout is hence $75.00 + x = $85.00 (Upside: +13.33%). ICE is expected to consolidate at $85.00 thereafter, before it will resume its LT upwave beyond $85.00.

The Donovan Norfolk Technical Rating:
Bullish

CME Group Inc (NASDAQ: CME) 17 July 2018, Tuesday, 2.45pm Singapore Time

CME Group Inc (NASDAQ: CME) 
17 July 2018, Tuesday, 2.45pm Singapore Time
(Click on Technical Chart above to Expand)

Attached is the Technicals for CME Group that is listed in the US Market (NASDAQ: CME).
The 1st two green circles illustrate smart money buys. The red volume circled in yellow is bullish absorption (high volume). Thereafter, CME Group engaged in a series of high volume absorption of sells in the market -- forming a rounding bottom of re-accumulation too. We are not far off from the high volume absorption and the re-accumulation volumes by smart monies in Wall Street. The stock has been confirmed for long term uptrend now, as illustrated in the trinity of green circled regions. CME first target being $185 per share upon breakout. Thereafter, it may consolidate and move beyond $185 in the LT. I expect strong bull market to stimulate trading volumes and boost up CME share prices.

The Donovan Norfolk Technical Rating:
Bullish

Sunday, 15 July 2018

USDCNH (USD against Chinese Yuan): 15 July 2018, Sunday, 8.32pm Singapore Time

USDCNH (USD against Chinese Yuan): 
15 July 2018, Sunday, 8.32pm Singapore Time
(Click on Technical Chart above to Expand)

Attached is the Technicals for USDCNH (USD against offshore Chinese Yuan). 

As this is a chart of USDCNH, an upmove means USD up and Chinese Yuan down while a downmove represents USD down and Chinese Yuan up with respect to each other.

The 2 red lines represent an Inverse (Reverse) Bump-and-Run which is essentially similar in nature to Dump-for-Entry. This is very bearish for the Chinese currency. The movement tallies with my earlier fore-warnings on my Facebook Wall Tweets that China will definitely have Chinese Yuan depreciate sharply to circumvent the US Trade Tariffs. Everything is enacting to my early analyses -- the Chinese Yuan plunged a sharp 4400 pips in a short time (around -7.00%) against the greenback and my smart followers made significant profits from the earlier fundamentals-logic deductions.

In the price structure above, note that an inverse bump-and-run means that the Chinese Yuan had already peaked (USDCNH bottomed) and is resuming a very long term downtrend, i.e. USDCNH will go up indefinitely in the current economic cycle. As even the USD itself is expected to peak too in its current dead cat bounce, this means that Chinese Yuan will be some of the weakest currencies of all currencies in the world (except of course the Venezuela Bolivar). From "trade war" which may fizzle out, the next bout may be currency war (the race to the bottom) between the world's number 1 economy and the world's number 2 economy.

The Donovan Norfolk Technical Rating:
Chinese Yuan Bearish against USD and 90% of all currencies worldwide. 
(Chinese Renminbi resumption of long term downtrend)


Saturday, 14 July 2018

DJIA, S&P500, NASDAQ, Commodities and Crude Oil (5-In-1) Technicals: 14 July 2018, Saturday, 4.50pm Singapore Time

DJIA, S&P500, NASDAQ, Commodities and Crude Oil (5-In-1) Technicals: 
14 July 2018, Saturday, 4.50pm Singapore Time
(Click on Technical Chart above to Expand)

Attached is the DJIA, S&P500, NASDAQ, Commodities and Crude Oil (5-In-1) Technicals presented as One Chart. As per the characteristics which I had taught all along (that the NASDAQ and Tech are always the most leading indicators in market cycles and that the Singapore market is the most honest indicator in the world reflecting global economic health), the NASDAQ Composite leads once again. It has broken the key resistance of its large rounding bottom of re-accumulation and backtested the key resistance-turned-support at 7500 points successfully. This means world markets (including laggard DJIA and S&P500) to rally sharply soon. Commodities have also completed their backtesting and confirming their uptrend supports in yellow (refer chart) and ready to resume the next large wave up. All expected trajectories are in green.

The Donovan Norfolk Technical Rating of Worldwide Markets:
Bullish. 
Long Term Bull Market, and Long Term Uptrends Successfully Confirmed.


Thursday, 12 July 2018

Comfortdelgro: 12 July 2018, Thursday, 9.36am Singapore Time

Comfortdelgro:
12 July 2018, Thursday, 9.36am Singapore Time
(Click on Technical Chart above to Expand)

Attached is the in-depth hourly, 4-hourly, daily and weekly Technicals for Comfortdelgro, the largest taxi company in Singapore and is listed in the Singapore SGX.
I have added more Comfortdelgro buys at $2.37.


Wednesday, 11 July 2018

Genting Singapore: 11 July 2018, Wednesday, 9.47am Singapore Time

Genting Singapore: 
11 July 2018, Wednesday, 9.47am Singapore Time
(Click on Technical Chart above to Expand)

Attached is the Technicals for Genting Singapore that is listed in the Singapore SGX. 
I am adding some Genting buys at $1.19.


Tuesday, 10 July 2018

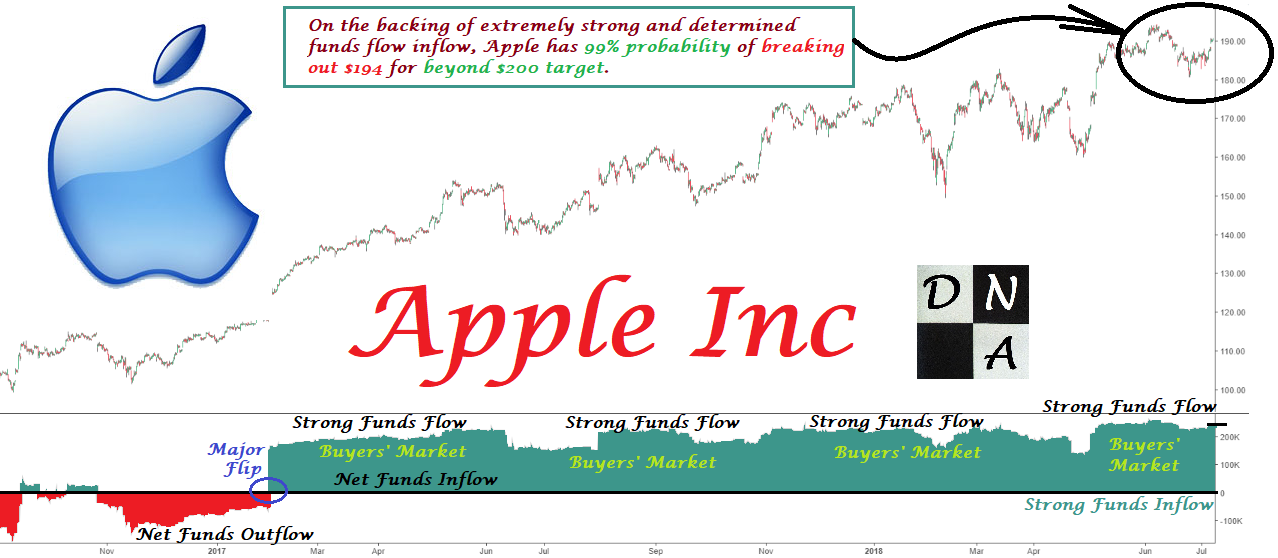
Funds Flow Analysis of Apple Inc (NASDAQ: AAPL): 10 July 2018, Tuesday, 9.36pm Singapore Time

Funds Flow Analysis of Apple Inc (NASDAQ: AAPL): 
10 July 2018, Tuesday, 9.36pm Singapore Time
(Click on Funds Flow Chart above to Expand)

Attached is the funds flow analysis of Apple Inc that is listed in the US market (NASDAQ: AAPL). The red region illustrates where the stock experienced net funds flow outflow while the green region illustrates where the stock received funds flow net inflow from the international market. The blue circled region is the region of flip from funds outflow to funds inflow (impulsive flip). Thereafter, Apple began its resumption of upmove from $125 to $194 per share. Apple Inc has retraced to $190.58 region under the backdrop of very powerful funds flow net inflow. On the backing of extremely strong and determined funds flow inflow, Apple has 99% probability of breaking out $194 for beyond $200 target.


Funds Flow Analysis of Ring Energy Inc (AMEX: REI): 10 July 2018, Tuesday, 12.20am Singapore Time


Funds Flow Analysis of Ring Energy Inc (AMEX: REI): 
10 July 2018, Tuesday, 12.20am Singapore Time
(Click on Funds Flow Chart above to Expand)

Attached is the funds flow analysis of Ring Energy Inc (AMEX: REI) that is listed in the US market. The red region illustrates where the stock experienced funds flow net outflow while the green region illustrates where the stock receives funds flow net inflow from the market. The blue circled region is the region of flip from funds outflow to impulsive funds inflow. Thereafter, the stock went gradually up from $10.00 to $17.00, a gain of +70%. Ring Energy Inc has retraced to $13.73 region and has successfully tested double black lined support under the backdrop of strong funds inflow (black circled region). It is expected to rally beyond $17.00 resistance.


Monday, 9 July 2018

Genting Singapore: 9 July 2018, Monday, 3.45pm Singapore Time

Genting Singapore: 
9 July 2018, Monday, 3.45pm Singapore Time
(Click on Technical Chart above to Expand)

Attached is the Technicals for Genting Singapore. 
I am adding some buys at $1.19.


Friday, 6 July 2018

Updated Technicals of Development Bank of Singapore (DBS): 6 July 2018, Friday, 12.59pm Singapore Time

Updated Technicals of Development Bank of Singapore (DBS): 
6 July 2018, Friday, 12.59pm Singapore Time
(Click on Technicals above to Expand)

Attached is the updated Technicals for DBS. The red circled regions are Super-cycle resistances. The first green circled region is where and when the Super-Cycle Uptrend Confirmation had been achieved for DBS Bank. Markets are currently using the supposed 2nd-ABSD property cooling and the supposed trade war to backtest the Super-Cycle Resistance-Turned-Support Band in Black. The 2nd green circled region is the backtest as shown by the blue trajectory. After this backtest, DBS is projected to hit $25.00+$17.50 = $42.50 based purely from technicals (refer chart to see the TA-mathematics). However, my expectation of DBS based on forward fundamentals and of the bank riding the digital tide well as a front-runner will mean that my $53.42 target staunchly remains. Shorting is high risk, buying and investing is low risk with high rewards. DBS is expected to follow the dark blue trajectory. 


Thursday, 5 July 2018

Singapore Property Stocks: 5 July 2018, Thursday, 8.45pm Singapore Time

Just 10 hours ago, I publicly revealed in a funds flow (cards counting) revelation that based on my own comprehensive funds flow model, Singapore Property Stocks  had been on intense Outflow in Dominant Order Flow for the past 6 months. 

Just some 10 hours later,  out came this news:


The main headlines read:
"The government announced it would raise Additional Buyer Stamp Duty (ABSD) rates and tighten Loan-to-Value (LTV) limits on residential property purchases in an effort to cool the property market and keep price increases in line with economic fundamentals"

In private messages with a professional from the property market sector some time ago, I even told the professional the below observation based on market funds flow:


I told the professional that property stocks' funds flow suddenly derailed 6 months ago -- to a sudden change to very intense Dominant Order Outflow (Oxley stocks the exception). 

Today the reason for that is known now: raising of Additional Buyer Stamp Duty (ABSD) the real reason. 

And it may also be the reason why Bank Stocks were on temporary short term Outflow in Dominant Order Flow -- and ONLY recently. Banks' earnings come from a large myriad of sources, and property market is one source, enough to blip them a little during the cooling exercise but not derail them, which is why they are last to react but does not break their long term uptrend. On the other hand, the developers, especially those which had spent high amount of monies to bid for land and for en bloc bids, they are in for some tough time ahead now. 

It is why so far, I had avoided analysing property stocks as far as I could, doing some analysis only for Guocoland, and only because it is diverse in many countries and technicals looked good. Interest rates and cooling measures are always a sword hanging from just above: Rewards are there, sword (risk) is also there.


New Funds Flow Dynamics of Tesla Inc (NASDAQ: TSLA): 5 July 2018, Thursday, 3.59pm Singapore Time

New Funds Flow Dynamics of Tesla Inc (NASDAQ: TSLA): 
5 July 2018, Thursday, 3.59pm Singapore Time
(Click on Funds Flow Chart above to Expand)

Attached is the new funds flow dynamics of Tesla Inc (NASDAQ: TSLA). There were panic unloads on fear in end-March 2018, and this outflow was supposed to change the dynamics of Tesla into a sellers' market (funds outflow market). Thereafter, by May 2018, there were some signs that strong hands saved Tesla with intentions in the market, or the funds that sold bought back everything. This strong intention to save Tesla in the market was double confirmed in June 2018 (2nd green circled region). Tesla has broken down the dark brown support, but under net funds inflow in the mid term, and with green and blue supports as illustrated, I will not dare to be bearish or shorting Tesla as the risk for shortists is high. Instead, if one has guts, one should look to buy on dips at orange circled region.


Wednesday, 4 July 2018

CapitaCom Trust: 4 July 2018, Tuesday, 8.28am Singapore Time

CapitaCom Trust: 
4 July 2018, Tuesday, 8.28am Singapore Time
(Click on Technical Chart above to Expand)

Attached is the Technicals for CapitaCom Trust that is listed in the Singapore SGX (SGX: C61U).
The entire series of distribution for this reit/trust is as illustrated on chart starting with how plenty of fools bought reits/trusts and how they were dumped and how $1.655 support was then deliberately broken down with volume to trap these investors and traders. The new long term downtrend for CapitaCom Trust has been established with the high volume breakdown of the $1.655 support. The next target is $1.35 for this reit/trust. Reits and Trusts worldwide are preparing for next big wave down. Note: stocks, which are risk-ons, are bullish; utilities, reits, trusts and telcos, which are risk-offs, are bearish.

The Donovan Norfolk Technical Rating:
Bearish
【Risk-on stocks are bullish, risk-off reits-trusts and telcos are bearish】

Tuesday, 3 July 2018

ST Engineering: 3 July 2018, Tuesday, 2.45pm Singapore Time

ST Engineering: 
3 July 2018, Tuesday, 2.45pm Singapore Time
(Click on Technical Chart above to Expand)

Attached is the Technicals for ST Engineering that is listed in the Singapore SGX (SGX: S63). ST Engineering is currently at the Large Uptrend's Buying Pressure Zone in green. It had previously turned the resistance at $3.10-$3.26 the new long term bull market support. The volume flow in orange circled region is healthy. These are strong volume flow. ST Engineering is at strong buying zone of $3.10-$3.26 now. This is a stock that has fundamentals too.

The Donovan Norfolk Technical Rating:
Long Term Bullish within Bull Market

Wilmar International: 3 July 2018, Tuesday, 2.28pm Singapore Time

Wilmar International: 
3 July 2018, Tuesday, 2.28pm Singapore Time
(Click on Technical Chart above to Expand)

Attached is the Technicals for Wilmar International that is listed in the Singapore SGX. Wilmar is currently doing a large rounding bottom of re-accumulation. The Inverse Shoulder-Head-Shoulder in play (illustrated in brown) is helping to propagate fear, with success as well. The price structure is a large price structure of uptrend.  

The Donovan Norfolk Technical Rating:
Long Term Bullish within Bull Market

United Overseas Bank: 3 July 2018, Tuesday, 1.27pm Singapore Time

United Overseas Bank: 
3 July 2018, Tuesday, 1.27pm Singapore Time
(Click on Technical Chart above to Expand)

Attached is the Technicals for United Overseas Bank (UOB) that is listed in the Singapore SGX. UOB Bank is at multi-layered strong supports in a bull market. Buy the dip while the whole world is calling for bear market with conviction.
UOB Current price @1.27pm:  $26.49.

The Donovan Norfolk Technical Rating:
Bullish


Monday, 2 July 2018

Funds Flow Analysis of Diamondback Energy (NASDAQ: FANG): 2 July 2018, Monday, 1.55pm Singapore Time

Funds Flow Analysis of Diamondback Energy (NASDAQ: FANG): 
2 July 2018, Monday, 1.55pm Singapore Time
(Click on Funds Flow Analysis Chart above to Expand)

Attached is the Funds Flow Analysis on Diamondback Energy, the apple of the crude oil industry and is listed in the NASDAQ (NASDAQ: FANG). The black circled region is the region where under the background of strong funds flow inflow, the breakout could already be expected before it even happened. Following the breakout, Diamondback Energy received even more funds flow inflow (pile-up in buys on the stock). The powerful funds flow state remains with Diamondback Energy. Smart monies show no sign of selling. Diamondback Energy looks set for a super rocket upmove to indefinite historical highs never seen before -- Bullish. Buy.