Ticker 1

Ticker 2

Click "Like" to Receive First Hand Updates From The Analysis Site / Click "SHARE" to share

Showing posts with label Light Crude Oil. Show all posts

Friday, 21 June 2019

Crude Oil (NYMEX/WTI Oil): 21 June 2019, Friday

Crude Oil (NYMEX/WTI Oil):
21 June 2019, Friday
(Click on the Technical Chart Above to Expand)

Attached is the Daily Chart Technicals for Crude Oil.
All analyses and illustrations are as attached on technical chart.
The proper interpretation for crude oil technicals is called 【Inverse Bump-and-Run】. Inverse-Bump-and-Run in technical theory is equivalent to 【Shake-and-Collect】 in technical theory. The first trend line is called the lead-in line. Technicals for Crude Oil is bullish (Strong Accumulation). Crude oil stocks and energy related stocks are bullish biased.

DISCLAIMER
This analysis site, as well as the analyses in it, is created for the sole purpose of education, discussion, fundamental analysis knowledge sharing, technical analysis knowledge sharing, funds flow analysis knowledge sharing, general skills-knowledge sharing and opinions sharing. The contents of this blog are not to be taken as investment advice or inducement to trade, and I take no responsibility for any gains or losses as a result of reading my analyses, judgements and opinions. In essence, practise due diligence. 

Friday, 17 May 2019

Crude Oil (WTI Oil): 17 May 2019, Friday, 7.11pm Singapore Time

Crude Oil (WTI Oil): 
17 May 2019, Friday, 7.11pm Singapore Time

Attached is the Technicals of Crude Oil (WTI Oil) which has moved according to my forewarned directions as explained in my previous analyses and Facebook Tweets. All my followers are in the green now. Crude Oil Stocks take heed of directions from the Crude Oil Primary Sources Market. Things to take note: 1. Bull's Fan (Perfect Technicals); 2. Bullish Rounding Bottom achieved in the intra-days; 3. Worldwide Smart Monies had been bullish in the Crude Oil market as highlighted the past 6 months when it was below $60 and to add icing to the cake, the market-makers were joining the large longs as taught in funds flow theoretical models and calculations. When big monies are not obstructed by market-makers, extraordinary events happen. Crude oil stocks are bullish biased -- to the exent even Warren Buffett is scooping crude oil stocks cheaply now. He knows his stuff.

 Funds Flow Analysis
Funds Flow Analysis


DISCLAIMER

This analysis site, as well as the analyses in it, is created for the sole purpose of education, discussion, fundamental analysis knowledge sharing, technical analysis knowledge sharing, funds flow analysis knowledge sharing, general skills-knowledge sharing and opinions sharing. The contents of this blog are not to be taken as investment advice or inducement to trade, and I take no responsibility for any gains or losses as a result of reading my analyses, judgements and opinions. In essence, practise due diligence. 

Monday, 15 April 2019

Crude Oil (WTIC Oil): 15 April 2019, Monday

Crude Oil (WTIC Oil):
15 April 2019, Monday
(Click on Technical Chart above to Expand)

Attached is the follow-up Technicals on Crude Oil (WTI Oil). Following my previous live analyses (refer to past track records on analysis site), my followers are now sitting on an average of 【+700 pips of profits】 per contract, and this is just the early phase of jackpot. The green circled region is my live analyses forewarning that crude oil had been bought up by the best hunters in the financial arena and that market makers were joining in (Funds Flow of Special Market Makers all over the world taught to funds flow specialists).  Crude oil is currently maintaining its strong uptrend and developing bullish divergence even during healthy pullback.
【All Crude Oil Stocks to be highly bullish postured for 2H-2019. 】

The Donovan Norfolk Rating:
Bullish Bias
(Commodities, Energy, Crude Oil to experience buying pressure on every dip; every dip is a buying opportunity)

 Funds Flow Analysis
Funds Flow Analysis


DISCLAIMER

This analysis site, as well as the analyses in it, is created for the sole purpose of education, discussion, fundamental analysis knowledge sharing, technical analysis knowledge sharing, funds flow analysis knowledge sharing, general skills-knowledge sharing and opinions sharing. The contents of this blog are not to be taken as investment advice or inducement to trade, and I take no responsibility for any gains or losses as a result of reading my analyses, judgements and opinions. In essence, practise due diligence. 

Sunday, 24 March 2019

Crude Oil (WTIC Oil): 24 March 2019, Sunday

Crude Oil (WTIC Oil):
24 March 2019, Sunday
(Click on Technical Chart above to Expand)

Attached is the follow-up, more macroscopic and updated technicals of Crude Oil. The Black Band with a Grey Mid-band is the long term resistance termed into long term support -- at a time when market majority are bearish and shorting while smart monies continue to buy against the crowd. The S2 support in black circled region is illustrated where markets did not back-test S1 as resistance-turned-support, and instead markets back-tested S2 as resistance-turned-support in end-2018 (I had forewarned that there would be bullish strength there back in end-2018 when the 90% market herd were bearish with conviction). There will be just minor dip for crude oil. Minor dips are for buying. Should you be in major bearishness for crude oil? The answer is no. There will be more waves of buy orders inundating into the market when crude oil hits around the $56.00 region of buy zone backtest.

The Donovan Norfolk Rating:
Bullish Bias
(Commodities, Energy, Crude Oil to experience buying pressure on every dip; every dip is a buying opportunity)

 Funds Flow Analysis
Funds Flow Analysis


DISCLAIMER

This analysis site, as well as the analyses in it, is created for the sole purpose of education, discussion, fundamental analysis knowledge sharing, technical analysis knowledge sharing, funds flow analysis knowledge sharing, general skills-knowledge sharing and opinions sharing. The contents of this blog are not to be taken as investment advice or inducement to trade, and I take no responsibility for any gains or losses as a result of reading my analyses, judgements and opinions. In essence, practise due diligence. 

Wednesday, 20 March 2019

Crude Oil (WTIC Oil): 20 March 2019, Tuesday

Crude Oil (WTIC Oil):
20 March 2019, Tuesday
(Click on Technical Chart above to Expand, and Analyse my Technical Lines in Detail)

Attached is the detailed intraday technicals of Crude Oil. Worldwide Smart Monies are buying up the crude oil markets as calculated by Funds Flow Analyses earlier. It is all enacting and unrolling per planned. Market makers will not stop the Adam Smith's invisible hand pushing up the market -- as analysed using The Donovan Norfolk Funds Flow Analysis -- the father of all funds flow paradigm. Crude oil and crude oil related stocks will keep going up.

The Donovan Norfolk Rating:
Bullish Bias
(Commodities, Energy, Crude Oil to experience buying pressure on every dip; every dip is a buying opportunity)

 Funds Flow Analysis
Funds Flow Analysis


DISCLAIMER

This analysis site, as well as the analyses in it, is created for the sole purpose of education, discussion, fundamental analysis knowledge sharing, technical analysis knowledge sharing, funds flow analysis knowledge sharing, general skills-knowledge sharing and opinions sharing. The contents of this blog are not to be taken as investment advice or inducement to trade, and I take no responsibility for any gains or losses as a result of reading my analyses, judgements and opinions. In essence, practise due diligence. 

Wednesday, 20 February 2019

Light Crude Oil (WTI Oil): 20 February 2019, Wednesday, 11.11am Singapore Time


Light Crude Oil (WTI Oil): 
20 February 2019, Wednesday, 11.11am Singapore Time

Attached is the Technicals for Light Crude Oil (WTI Oil). The continuation in uptrend is in progress. There is confirmation now. The uptrend is in line with the Super Root of All Funds Flow that dictates how energy markets and commodity markets should move up, and also in line with smart money funds flow in international energy markets (refer to past teachings). The left inverse shoulder is bullish accumulation, the inverse head being massive re-accumulation in line with funds flow of international markets and the right inverse shoulder as illustrated was the recent final re-accumulation using fear. The shakeout on weak-minded market majority of traders and dis-orientated investors has been completed (brown circled region). We are in for relentless all time new highs.

The Donovan Norfolk Technical Rating:
Bullish with no end in sight for 2019.


 Funds Flow Analysis
Funds Flow Analysis


DISCLAIMER

This analysis site, as well as the analyses in it, is created for the sole purpose of education, discussion, fundamental analysis knowledge sharing, technical analysis knowledge sharing, funds flow analysis knowledge sharing, general skills-knowledge sharing and opinions sharing. The contents of this blog are not to be taken as investment advice or inducement to trade, and I take no responsibility for any gains or losses as a result of reading my analyses, judgements and opinions. In essence, practise due diligence. 

Monday, 7 January 2019

The Real Technicals of Crude Oil, Crude Oil Related Stocks and Worldwide Equity Cycle: 7 January 2019, Monday, 11.38pm Singapore Time


The Real Technicals of Crude Oil, Crude Oil Related Stocks and Worldwide Equity Cycle: 
7 January 2019, Monday, 11.38pm Singapore Time
(Click on Technical Chart above to Expand)

Attached is the Real Technicals of Crude Oil, and hence Crude Oil Related Stocks and Worldwide Equity Cycle. The large blue Inverse Shoulder-Head-Shoulder is as illustrated on Chart. It illustrates how crude oil was suppressed below the orange band of neckline, changed in dynamics (first green circled region) and then achieved breakup of the neckline in 2017 to confirm for new spring for energy markets. In 2018, Trump's trade war merely confirmed the neckline band as support. This support is for double confirmation purposes -- that we are in midpoint of Equities' Secular Bull Market Cycle. 

The bottom of the crude oil at $26.05 fell in tune to my live fore-warnings back in 1Q-2016 declaring that $30 per barrel would be rock bottom. It had enacted according to my fore-warnings during 2016. Notice in dark green circled region that trade war in 2018 was used to shake out weak holders and to concurrently execute backtest confirmation of the orange band neckline (turned support). This backtest is for confirming the large supercycle upmove in energy markets -- for crude oil to go beyond $100 per barrel in the coming few years. 

This all falls in line with the 2nd half of the Secular Bull Market Cycle which I had been pre-empting for. 95% of naive ignorant herd are bearish and still calling for bear market; only 5% true professionals are bullish, and that includes hedge funds and smart monies who belong to the 5%. 2nd half of bull market cycle is coming, and 2nd halves are where majority gains for all stocks across the board are made. 

All energy crude oil stocks and all commodity and raw material stocks are brewing for explosive up-cycle. Watch how my fore-warnings will get enacted once again. 

【Do not follow the 95% herd shouting for bear market or drawing bearish charts: the bull market still has another at least 3-5 years (and up to 10 years) of multi-bagger upmoves to come. We are at just mid-cycle of Secular Bull, and 2nd half is where accelerated majority gains are to be made. 】

The Donovan Norfolk Technical Rating:
Bullish with no end in sight for 2019.


 Funds Flow Analysis
Funds Flow Analysis


DISCLAIMER

This analysis site, as well as the analyses in it, is created for the sole purpose of education, discussion, fundamental analysis knowledge sharing, technical analysis knowledge sharing, funds flow analysis knowledge sharing, general skills-knowledge sharing and opinions sharing. The contents of this blog are not to be taken as investment advice or inducement to trade, and I take no responsibility for any gains or losses as a result of reading my analyses, judgements and opinions. In essence, practise due diligence. 

Tuesday, 4 September 2018

US Light Crude Oil (WTI Oil): 4 September 2018, Tuesday, 3.00pm Singapore Time

US Light Crude Oil (WTI Oil): 
4 September 2018, Tuesday, 3.00pm Singapore Time
(Click on Technical Chart above to Expand)

Attached is the 4-Hourly Crude Oil Technicals.
I am adding some more Longs on US Light Crude Oil (WTI Oil) @ 7004.5 points ($70.045 per barrel). Technicals as attached. Crude oil has broken up black resistance trend band as illustrated on chart. It has also broken up the 50MA and 200MA resistance and turned them into green supports. It has also backtested successfully the multiple smoothed MA in blue as support.
Take short term profits at 7344 points ($73.44 per barrel). Crude oil related stocks may have a buying pressure as well, especially those listed in the US markets.


Thursday, 26 July 2018

Light Crude Oil: 26 July 2018, Thursday, 8.39am Singapore Time

Light Crude Oil:
26 July 2018, Thursday, 8.39am Singapore Time
(Click on Technical Chart above to Expand)

Attached is the technicals for Light Crude Oil. The classical resistance in orange at $66.00 has been backtested and confirmed for long term upmove. The series of red circled regions and green circled regions show how the resistance has been turned into a support of strength. The black trend line band is guiding the general big bull of the crude oil market.
【Next Light Crude Oil targets (WTIC Oil): $77.50 and $80.00 respectively.】

Saturday, 14 July 2018

DJIA, S&P500, NASDAQ, Commodities and Crude Oil (5-In-1) Technicals: 14 July 2018, Saturday, 4.50pm Singapore Time

DJIA, S&P500, NASDAQ, Commodities and Crude Oil (5-In-1) Technicals: 
14 July 2018, Saturday, 4.50pm Singapore Time
(Click on Technical Chart above to Expand)

Attached is the DJIA, S&P500, NASDAQ, Commodities and Crude Oil (5-In-1) Technicals presented as One Chart. As per the characteristics which I had taught all along (that the NASDAQ and Tech are always the most leading indicators in market cycles and that the Singapore market is the most honest indicator in the world reflecting global economic health), the NASDAQ Composite leads once again. It has broken the key resistance of its large rounding bottom of re-accumulation and backtested the key resistance-turned-support at 7500 points successfully. This means world markets (including laggard DJIA and S&P500) to rally sharply soon. Commodities have also completed their backtesting and confirming their uptrend supports in yellow (refer chart) and ready to resume the next large wave up. All expected trajectories are in green.

The Donovan Norfolk Technical Rating of Worldwide Markets:
Bullish. 
Long Term Bull Market, and Long Term Uptrends Successfully Confirmed.


Wednesday, 9 May 2018

Crude Oil Weekly, Daily, 4-Hourly and Hourly Chart Concurrent Technical Update: 9 May 2018, Wednesday, 11.00pm Singapore Time

Crude Oil Weekly, Daily, 4-Hourly and Hourly Chart Concurrent Technical Update: 
9 May 2018, Wednesday, 11.00pm Singapore Time
(Click on Technical Chart above to Expand)

Attached above is the Crude Oil Weekly, Daily, 4-Hourly and Hourly Chart Concurrent Live Technical Update. This is how bullish the Crude Oil is, that its technicals on all major timeframes are hyper bullish concurrently. The price actions coupled with ATR and Momentum are very bullish biased. More upmoves coming. My followers' Crude Oil Live Trade Longs (Positional Trades) are now bursting with profits. Congrats to everyone.

Tuesday, 1 May 2018

Crude Oil Technical Analysis: 1 May 2018, Tuesday, 7.24pm Singapore Time

Crude Oil Technical Analysis: 
1 May 2018, Tuesday, 7.24pm Singapore Time
(Click on Technical Chart above to Expand)

Attached above is the Technicals for Crude Oil. What you will learn here is that The Chande Trend Meter (CTM) and the Ease of Movement (EMV) can often be used together to observe for high probability trends and how easy the trends can be achieved. In this case, notice how in December 2017 to April 2018, I had already fore-warned (before prices moved) that Crude Oil will easily move up without much obstruction in its uptrend. It had indeed moved up from $55 to $68 easily, a gain of 1300 pips (pts) in the crude oil market. EMV was mostly positive while CTM was mostly in Green Zone. In doing so, now Crude oil has broken up a Mid-Term Ascending Triangle with a successful backt-test in Green. The width of triangle is $8.00. This will yield a target price of $74.00. As the triangle is a mid-term structure, this means Crude Oil will move to $74.00 in the mid term (next 3 to 4 months). All Crude Oil stocks worldwide will move significantly up in the mid term (next 3 months). 

Lastly, as a further induction from this move, a move into the $70.00 zone will move Crude Oil beyond the $100.00 mark more than 80% of the time in the long term based on past precedents. 

Additional Note:
Besides almost all Crude Oil stocks worldwide, taking US markets as an example, these Energy ETFs will also move significantly up in the next 3 months (mid-term): 

Direxion Daily Energy Bull 3X Shares (NYSE: ERX),  
Vanguard's Energy ETF (NYSE: VDE), 
Energy Select Sector SPDR (NYSE: XLE),
 iShares U.S. Oil & Gas Exploration & Production ETF (NYSE: IEO), 
Market Vectors Oil Services ETF (NYSE: OIH), 
PowerShares DWA Energy Momentum Portfolio ETF (NYSE: PXI) 

All Crude Oil, Crude Oil Currencies and Crude Oil Related Stocks:
Highly Bullish

Mid Term TP: $74.00
Long Term TP: Beyond $100.00
Secular SuperCycle Term TP: $175-$180 
(refer to previous Crude Oil and USD SuperCycle Analysis)

Past Crude Oil Analyses:


Monday, 26 March 2018

Light Crude Oil (WTI Oil) Intraday Funds Flow: 26 March 2018, Monday, 8.10pm Singapore Time

Light Crude Oil (WTI Oil): 
26 March 2018, Monday, 8.10pm Singapore Time 
(Click on FFA Chart above to Expand)

Attached is the International Light Crude Oil (WTI Oil) Intra-day Funds Flow. While almost all people in the markets were bearish of the markets as well as the crude oil and energy markets, smart monies like me were bullish in the crude oil markets. My Crude Oil Live Trades on 5th March 2018 and 21st March 2018 (refer to previous technical analyses on analysis site) have yet again further mushroomed in profits now. 
Crude oil and crude oil related stocks: Bullish.


Thursday, 22 March 2018

The New Supercycle of Crude Oil: 22 March 2018, Thursday, 4.25pm Singapore Time

The New Supercycle of Crude Oil: 
22 March 2018, Thursday, 4.25pm Singapore Time

Attached above is an illustration of the projected trajectory for the new supercycle of crude oil. This is in line with my previous technical analyses showing how USD will be doing major wave down under Donald Trump, creating historical lows, boosting US exports and jump-starting the US manufacturing and industrial sectors. Gold, commodities, energy, crude oil, metals and raw materials will continue to rally non stop in the coming few years.

The Donovan Norfolk Technical Analysis Rating:
Bullish

Wednesday, 21 March 2018

Light Crude Oil (WTI Oil): 21 March 2018, Wednesday, 12.45am Singapore Time

Light Crude Oil (WTI Oil): 
21 March 2018, Wednesday, 12.45am Singapore Time
(Click on Technical Chart above to Expand)

Attached above is the technicals for International Light Crude Oil (WTI Oil). My live trade addition of longs on 5th March 2018 at $61.80 is deeply in the money now (refer to previous live technical analysis in my analysis site before prices moved). The yellow circled regions show how the eruption up in crude oil could be expected and the regions in pink show how any selling was deeply absorbed by the smart monies in the market for the past few days. The upside is high and continues to be high for crude oil. Bullish Bias. Add Buys at $63.676.

The Donovan Norfolk Technical Rating for Crude Oil:
Bullish

Monday, 5 March 2018

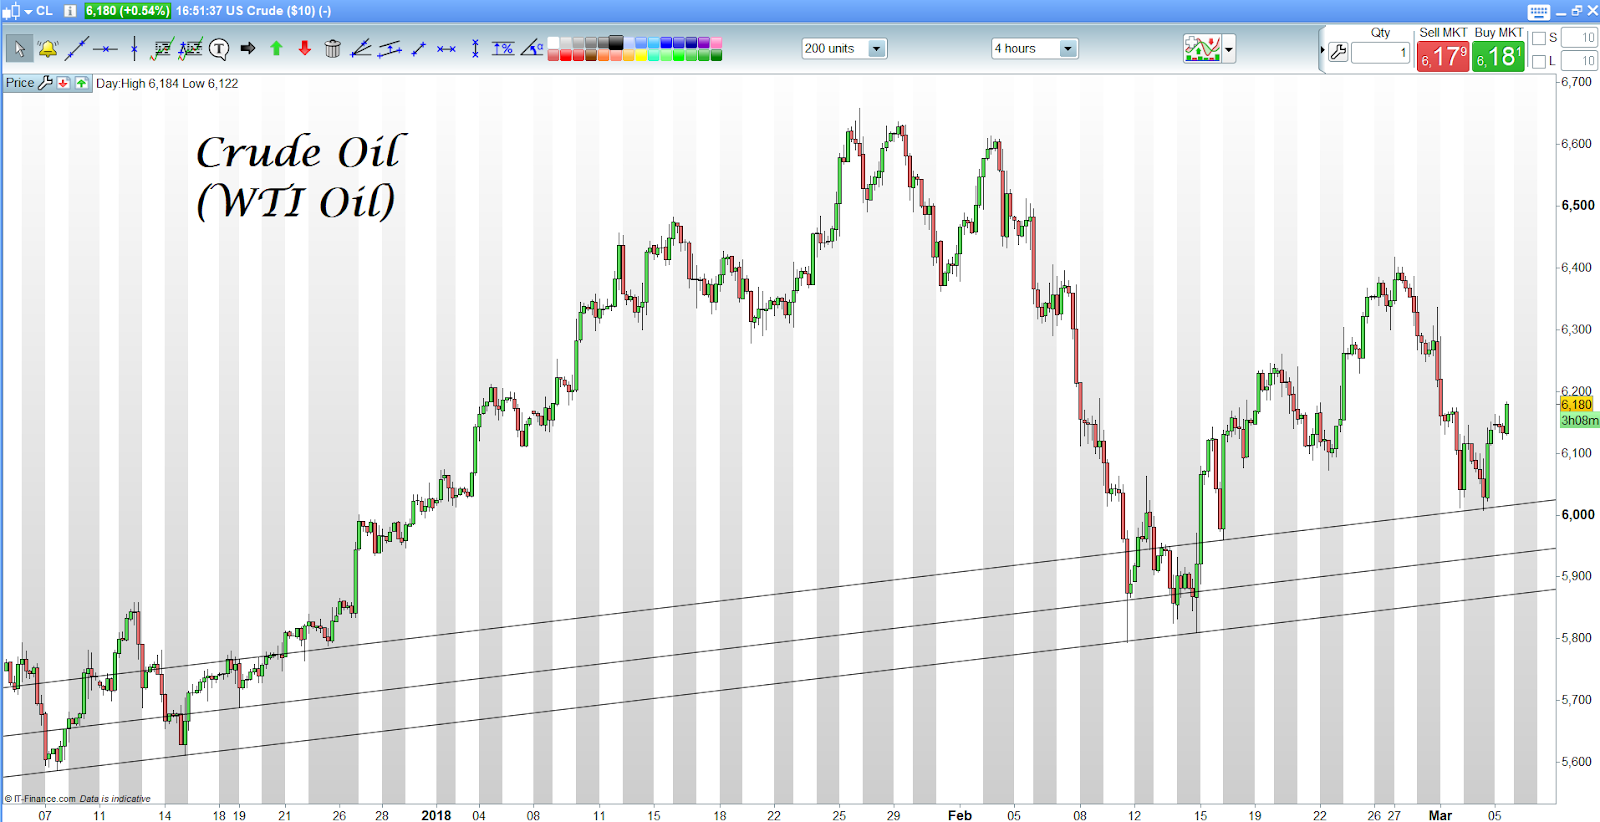
Crude Oil (WTI Oil): 5 March 2018, Monday, 4.58pm Singapore Time

Crude Oil (WTI Oil): 
5 March 2018, Monday, 4.58pm Singapore Time
(Click on Technical Chart above to Expand)

Added some longs on Crude Oil @ $61.80 area.


Wednesday, 21 February 2018

WTI Crude Oil: 21 February 2018, Wednesday, 11.42am Singapore Time

WTI Crude Oil: 
21 February 2018, Wednesday, 11.42am Singapore Time
(Click on Technical Chart above to Expand)

Attached is the technicals for WTI Crude Oil. The entire orange region is full of buy volumes which support the international crude oil market. Crude oil related stocks worldwide remain long term bullish with plenty of upsides. The light green rectangular zone is where if the tail of the candle gets taken out, crude oil will hasten its up-move. The blue zone is where international financial-commodity markets did not chase down crude oil nor to strike it down when the momentum iron was hot. It is bullish in nature.

The Donovan Norfolk Technical Rating on Crude Oil:
Mid Term and Long Term Bullish on Crude Oil
(Crude Oil Target: $175-$180 per Barrel)


Sunday, 28 January 2018

Crude Oil Target -- US$175 to US$180 per barrel: 28 January 2018, Sunday, 6.30pm Singapore Time

Crude Oil Target -- US$175 to US$180 per barrel: 
28 January 2018, Sunday, 6.30pm Singapore Time
(Click on Technical Chart above to Expand)

Attached above is the Super-Cycle Trajectories of International Light Crude Oil (WTI Oil). The Dark Yellow Circled Region is The Donovan Norfolk Live Warnings in 2H-2013 to 1H-2014 fore-warning that Crude Oil would crash soon when it was breathing above the $100 mark. A few months after my final warnings, crude oil started to crash from 3Q-2014. During 2013-2015, I had also forewarned that the impending weakness in crude oil would generally cause Asia markets to be weak and that would easily cause most people to lose money more than they would like to make money in investments and trades, this was enacted in Asia as well after my cautions. The importance of crude oil and its cascading multiplier effect to economies just cannot be under-rated.

The Green Circled Region is The Donovan Norfolk Live Analysis Rating in 1H-2016 putting US$30 per barrel as the rock bottom for Crude Oil Crash to end. Back then, the entire world shouted for US$10 per barrel crude oil. I had cautioned that anything below US$30 would be an overdone that had been caused merely by the herd who had acted sell on fear, a price not intended by smart monies and hedge funds, but for which would gladly be picked up as a buy-on-fear by smart monies and financial institutions. Why was The Donovan Norfolk Analysis so precise and deadly in accuracy? Refer to the grey support lines and you will learn why. Crude oil bottomed at precision in 1H-2016, in sync with The Donovan Norfolk Technicals for the universe of all asset classes interlinked. 

The Pink Classical Line of Resistance-Support shows the super-cyclically important S-R band for crude oil momentum at $45-$55 with the median or mean at $50, a psychologically important mark. Crude oil had back-tested this Super-cyclic Pink Line of Resistance-turned-Support in 4Q-2017.

In sync with the Trump-inspired weakness of the USD as analysed earlier, Crude Oil will be gunning for the US$170-US$180 per barrel target mark. This Target Point represents a +600% from The Donovan Norfolk Rock Bottom caught with precision back in 2016 (refer to past track record where I bought) and a +272% from current point which is less than halfway mark from eventual Target Point.

On an on-par basis, even blue chip oil-related stocks, large cap oil-related companies and elephants and mammoths have another +272% upside as the oil bullishness will trickle down with much larger multiplier effect generally. This kind of multiplier effect will also cascade in breadth to primary materials, raw materials, industrials, banking and finance, and many sectors in breadth. Even penny stocks and small cap companies will finally gain this time round.

On also an on-par basis, when this is not even the half-way mark for crude oil target, another +100% profits from all oil related companies regardless of their size of capitalisation is a conservative estimation and it will be highly achievable. Emerging Markets and Asia Markets will benefit greatly from the entire movement. Asia Equity Markets will start to create tsunamis of new highs every other month in 2018 and 2019 and with some likelihood into 2020 as well. Sustained historical highs like those in US can be expected for the rest of the world, and especially in Emerging Markets and Asia/Asia-Pacific.


5-Year Crude Oil Chart: 
28 January 2018, Sunday, 6.30pm Singapore Time
(Click on Technical Chart above to Expand)

The 5-year crude oil chart above shows how the crude oil price actions had interacted with the Super-cyclic $45-$55 critical band of resistance-turned-support in detail. Crude oil price actions made a first trinity of support cushions in 2H-2016 at the super-cyclic resistance-turned-support, with smart monies absorbing all sells in the financial markets on crude oil (deliberate intention).

The second trinity of deliberate buys occurred with high volumes in 2H-2017 (refer to 5-Year Crude Oil Chart above), a double confirmation of strong buy intentions, strong buying power and strong-willed holding of the market. The confirmation of mark-ups came towards the end of 2017 with the break-up of orange trendline resistance. This is a 3rd confirmation and a confirmation on the double trinity of intentions as highlighted previously (bullish).

With everything in sync in the financial markets, crude oil will be gunning for the $US170-$US180 per barrel target. It will break up the $100 psychological resistance. The difference between this time round and the previous $100 per barrel mark in 2014 is that majority of the market will be bearish on crude oil and shorting crude oil at the US$100 area this time round, when previously before the crash they were buying without fear but greed. This time round there will be so much fear of ghosts and crashes. This is because the 2014 crash history will still be fresh in their mind and the well-spun stories of renewable energy will continue to be so convincing that people will continue to be bearish of crude oil until crude oil eventually hits the high ground target. From $100 per barrel mark, crude oil will instead not follow the 2014-crude oil crash history, it will break the 2014 trend and further rally to US$170-US$180 per barrel to silent all its critics and burn short-sellers once and for all. Renewable energy may take over only from there, i.e. when everyone tramples the renewable energies as myths.

The Donovan Norfolk Technical Rating:
Very Bullish
(Expected to rally for the rest of 2018 and into 2019)

Additional Note:
The Supercycle Chart of Crude Oil here is the charts of West Texas Intermediate (WTI or NYMEX) Crude Oil prices per barrel dated back to 1946. The price of oil shown here is adjusted for inflation using the headline CPI and is shown on a logarithmic scale (log chart). The current month is updated on an hourly basis with today's latest value. 

Past Related Analyses (MUST READ IN DETAIL):


The US Dollar Super Big Downwave: 28 January 2018, Sunday, 12.37pm Singapore Time

The US Dollar Super Big Downwave Chart 1: 
28 January 2018, Sunday, 12.37pm Singapore Time
(Click on Technical Chart above to Enlarge)

This US Dollar Analysis is a prelude to the Crude Oil Market, Crude Oil related Stocks and Emerging Market Analysis to come. The analysis will be as detailed as possible to link much of the inter-asset class groups together. 

Before I proceed with this analysis, I would like to take this opportunity to thank the Malaysian stock and equity market community for their enormous support and kind gestures shown to me all this while. The Malaysians are some of the kindest and most humble people I have seen, ever eager to learn, absorb and improve. In particular, I am greatly inspired by the their unity and Kampung spirit, always looking out for one another in one tightly knitted community. They are the most humble and kind community I have countered. This explains my efforts in doing the more in-depth than usual analysis, to allow everyone to see the big picture and why Emerging Markets like Malaysia and the rest of Asia will hyper rally through the Trump-inspired US policies.

The Green Circled Regions are The Donovan Norfolk live forewarnings in 2012, 2013, 2014 and 2015 cautioning that the humongous Quantitative Easing (Q.E) by FED with its unlimited money printing will not cause USD to plunge, but instead to super rally, causing commodities, crude oil, energy, commodity stocks and emerging markets and their associated equities and currencies to be weak, and to result in nasty losses for majority of traders and investors in Asia. It all got enacted per my warnings and many Asian market investors suffered deadly losses in those years, true to my words.

The Red Circled Regions are The Donovan Norfolk live forewarnings in 4Q-2015, February 2017 and June 2017 cautioning that USD will have a large wave down soon, against market expectations of the majority herd as well, because most will expect USD to do large wave up due to rise in interest rates and money tightening on the USD. The USD large wave down will once again catch majority by jaw-dropping surprise and will be the exact reverse of the Green Circled Zone. USD major downwave will be happening in 2017, 2018, 2019 and beyond. Commodities, crude oil, energy, commodity stocks and emerging markets and their equities and currencies will become strong again. This will catch 99% of traders and investors big time off-guard, unless they are sharp and smart to have a professional mentor guide them.

The neckline of the large distribution top of the USD has just completed. Already, 90% of the market majority herd are caught on the wrong side of the markets relating to the outlook for all asset classes since 2016 and 2017. This is an exact replica of 2012-2016 market cycle except that the replica is in the reverse now. Most people will be double wrong again.

The US Dollar Super Big Downwave Chart 2: 
28 January 2018, Sunday, 12.37pm Singapore Time
(Click on Technical Chart above to Enlarge)

The attached above gives the most macroscopic perspective of the US Dollar. The US Dollar Index is expected to go down as a major wave to test for historical lows of around $80.00 again. It will likely go below $80.00 too. The US Dollar will create all time historical lows in the coming cycle (and people thought that money-tightening and rise in interest rate is supposed to bring USD up to the moon). The Trump-inspired trajectory down in the movement of the US Dollar will create a tsunami of stock market rally and commodities and energy market rally. In particular, stocks and equity markets of Asia will do a super rally of a lifetime. Now, is Trump and the US really anti-Asia or pro-Asia? Asia will have a super rally of a lifetime.

In particular, there will be a another big round of fishing-trawler style of scoop-ups from the rock bottom -- especially on commodity stocks (includes plantation stocks), energy stocks, crude oil related stocks, oil rig stocks, shale oil stocks, offshore oil and gas stocks, metal stocks, shipping stocks and shipbuilding stocks. With all these primary material class of stocks bullish, this bullish wave will be cascaded to all other sectors for impulsive wave of bullishness across the board (in equity markets for breadth). Finally, not only depth, even breadth will be coming now too.

In addition, as fore-warned in 2017 and 2018, a Gold price target of $1900-$2000 is guaranteed based on price structures on the Gold Technical Chart. Gold will rally with stocks, and Gold will rocket with acceleration if stocks crash, making Gold, Gold ETFs and Gold mining companies the NUMBER 1 PERFECT hedge and a MUST-HAVE in one's portfolio for protection against all directions. Yes, as ludicrous as it may be -- a protection against all directions. 


The Donovan Norfolk Technical Rating:
Very Bullish
(Expected to rally for the rest of 2018 and into 2019)

Additional Note:
The Supercycle Chart of USD above is based on the historical data showing the broad price-adjusted U.S. dollar index published by the Federal Reserve. The index is adjusted for the aggregated home inflation rates of all included currencies. The price adjustment is especially important with United States' Asian and South American trading partners due to their significant inflation episodes of the 80s and 90s.

Past Related Analyses (MUST READ IN DETAIL):

Tuesday, 23 January 2018

Sembcorp Marine, Keppel Corp and Implications for Worldwide Crude Oil and Energy Related Stocks (Includes Commodities and Shipping/Shipbuilding): 23 January 2018, Tuesday, 3.40pm Singapore Time

Sembcorp Marine, Keppel Corp and Implications for Worldwide Crude Oil and Energy Related Stocks (includes commodities and shipping/shipbuilding): 
23 January 2018, Tuesday, 3.40pm Singapore Time
(Click on Technical Chart above to Expand)

Attached is the technicals for Sembcorp Marine, a brother stock of Keppel Corp which is the largest oil-rig builder in the world. Sembcorp Marine and Keppel Corp are hence best indicators for crude oil demand in the world, especially that these 2 companies are highly sensitive to international market trends. Sembcorp Marine is used as analysis here as it is more eye-catching today.

Refer to all illustrations on chart: they highlight a lot of important information.

Sembcorp Marine has broken up large scale accumulation's resistances with deliberation, and that is to mean, all my live fore-warnings over the last 2 years on the secret buys by smart monies on crude oil stocks, crude oil related stocks, energy stocks, offshore oil and gas stocks and commodity stocks have completed. Markets will now proceed to super rally these kind of stocks worldwide, especially commodity stocks and crude oil (energy) stocks. 

Sembcorp Marine, Keppel Corp, crude oil stocks, crude oil related stocks, offshore oil and gas stocks, energy stocks and commodity stocks worldwide are jump-starting a whole new bull cycle, per my January 2018 forewarnings. This also means that shipping, shipbuilding and Baltic Dry Index worldwide had rock bottomed per my recent fore-warnings too because shipping, shipbuilding and Baltic Dry Index are tied up as a bundle to crude oil, crude oil related industries, offshore oil and gas, energy and commodities worldwide All these stocks will go multifold from +100% (large caps) to +1000% (small caps) with a mean of +500% profits (mid-caps) in upside.

The Donovan Norfolk Technical Rating:
Very Bullish
(Expected to rally for the rest of 2018 and into 2019)

Past Related Analyses (MUST READ IN DETAIL):