Ticker 1

Ticker 2

Click "Like" to Receive First Hand Updates From The Analysis Site / Click "SHARE" to share

Showing posts with label DBS. Show all posts

Wednesday, 30 December 2020

Technicals of DBS: 30 December 2020, 1.08am Singapore Time


Technicals of DBS:
30 December 2020, 1.08am Singapore Time
(Click on the Technical Chart Above to Expand)

Attached is the Technicals of DBS. I am no longer bullish of the markets. I am bearish of the stock markets. Volume flow traded for DBS stocks has not been bright as well. Anything gotten out at this week, like the price of $25.20, is a brilliant exit in my technical judgement. I expect DBS to break down $20.00 easily. 

The Donovan Norfolk Technical (DBS):
Bearish

DISCLAIMER

This analysis site, as well as the analyses in it, is created for the sole purpose of education, discussion, fundamental analysis knowledge sharing, technical analysis knowledge sharing, funds flow analysis knowledge sharing, general skills-knowledge sharing and opinions sharing. The contents of this blog are not to be taken as investment advice or inducement to trade, and I take no responsibility for any gains or losses as a result of reading my analyses, judgements and opinions. In essence, practise due diligence.  

Wednesday, 17 July 2019

Development Bank of Singapore (DBS): 17 July 2019, Wednesday

Development Bank of Singapore (DBS):
17 July 2019, Wednesday
(Click on the Technical Chart Above to Expand)

Attached is the updated Technicals of Development Bank of Singapore (DBS) that is listed in Singapore. It is the Donovan Norfolk Top Rated Stock of Singapore. DBS has successfully tested the Supercycle resistance-turned-support as indicated. DBS is preparing for Supercycle upmove. Supercycle upmove means: 1. Targets of $40.00 and $53.42 respectively; 2. Very big fat dividends very regularly. The green circled region highlights, based on technicals, how one is silly if one used Trump's trade war to sell.

DISCLAIMER
This analysis site, as well as the analyses in it, is created for the sole purpose of education, discussion, fundamental analysis knowledge sharing, technical analysis knowledge sharing, funds flow analysis knowledge sharing, general skills-knowledge sharing and opinions sharing. The contents of this blog are not to be taken as investment advice or inducement to trade, and I take no responsibility for any gains or losses as a result of reading my analyses, judgements and opinions. In essence, practise due diligence. 

Wednesday, 17 April 2019

Development Bank of Singapore (DBS): 17 April 2019, Wednesday

Development Bank of Singapore (DBS):
17 April 2019, Wednesday
(Click on the Technical Chart Above to Expand)

Attached is the Intraday Technicals of Development Bank of Singapore (DBS) that is listed in Singapore. It is the Donovan Norfolk Top Rated Stock of Singapore. The 2 Black Boxed Region is the Donovan Norfolk Live Warnings during Nov-Dec 2018 and Jan 2019 to buy the golden dip. During end-2018 and early 2019, I had forewarned that this would be the final chance to buy cheaply if one had failed to catch the 2016 bottom with me at $14.00-$17.00. During the maximum fear in end-2018 and early-2019, I had also guaranteed that there would be no bear market based on the Super Root of All Funds Flow. The grasp of the concept of the Root of Funds Flow separates the novices from the professionals. Study the intraday chart technicals for more in depth reading of the chart.


 Funds Flow Analysis
Funds Flow Analysis


DISCLAIMER

This analysis site, as well as the analyses in it, is created for the sole purpose of education, discussion, fundamental analysis knowledge sharing, technical analysis knowledge sharing, funds flow analysis knowledge sharing, general skills-knowledge sharing and opinions sharing. The contents of this blog are not to be taken as investment advice or inducement to trade, and I take no responsibility for any gains or losses as a result of reading my analyses, judgements and opinions. In essence, practise due diligence. 

Thursday, 4 April 2019

Kagi Trace of Development Bank of Singapore (DBS): 4 April 2019, Thursday

Development Bank of Singapore (DBS):
4 April 2019, Thursday
(Click on the Technical Chart Above to Expand)

Attached is the Technical Kagi Trace of Development Bank of Singapore (DBS) that is listed in Singapore. It is the Donovan Norfolk Top Rated Stock of Singapore. The 2 Dark Green Circled Regions are the Donovan Norfolk Live Warnings during Nov-Dec 2018 and Jan 2019 to buy the golden dip. During end-2018 and early 2019, I had forewarned that this would be the final chance to buy cheaply if one had failed to catch the 2016 bottom with me at $14.00-$17.00. During the maximum fear in end-2018 and early-2019, I had also guaranteed that there would be no bear market based on the Super Root of All Funds Flow. The grasp of the concept of the Root of All Funds Flow separates the novices from the professionals.

The price structure in black is the using of 1-year large bullish descending wedge to create fake directions (corrective wave of fake directions), thereby causing infliction of maximum fear with maximum shakeout on naive and misinformed herd -- people who do not know how to truly read financial markets' flow. By now, majority of the market had been bearishly smoked out on the wrong directions. The true direction is for large wave up. For DBS, this has now been jump-started by the breakout in light blue circled region.

The light blue circled region is also where my recent fore-warnings pinpointed more powerful upwaves coming, not only just for DBS but for many bank stocks worldwide as well. DBS target price is easily beyond $40 a share -- plus very fat consistent dividends -- DUAL GAINS. In my financial modelling, DBS Bank will ascend to become one of the top few banks in the world.


 Funds Flow Analysis
Funds Flow Analysis


DISCLAIMER

This analysis site, as well as the analyses in it, is created for the sole purpose of education, discussion, fundamental analysis knowledge sharing, technical analysis knowledge sharing, funds flow analysis knowledge sharing, general skills-knowledge sharing and opinions sharing. The contents of this blog are not to be taken as investment advice or inducement to trade, and I take no responsibility for any gains or losses as a result of reading my analyses, judgements and opinions. In essence, practise due diligence. 

Saturday, 2 March 2019

DBS Bank: 2 March 2019, Saturday, 1.16pm Singapore Time

DBS Bank: 
2 March 2019, Saturday, 1.16pm Singapore Time

Attached is the Technicals for DBS Bank that is listed in the Singapore SGX. It is the Donovan Norfolk Rated Top Stock of Singapore. Black Circled Region: The Donovan Norfolk Live Warnings back in Nov-Dec 2018 to buy the best stock such as DBS on the dip (when 90% of the herd were calling for bear market) because based on Funds Flow Theory -- The Super Root of All Funds Flow, there is to be no bear market. This was despite trade war fear at the maximum level. Most investors and traders were calling for bear market using technical analysis, but technical analysis fails most of the time. The knowledgeable funds flow practitioners combined fundamental analysis, technical analysis and funds flow analysis.

DBS Bank on track for 1st TP of $40.00 and 2nd TP of $53.42 respectively.
A number of fans whom I know will be making $100k-$1m in profits in this sole single trade without leverage. See you there, at the peak. When the true peak comes, just apply Root of All Funds Flow concepts, you will know what is true peak what is not, and separate yourself from the ignorant herd. Additional note: when DBS sets the pace up, it implies STI set to go up more, and Asia-Pacific is in good healthy uptrend.

The Donovan Norfolk Technical Rating:
Bullish with no end in sight for 2019.


 Funds Flow Analysis
Funds Flow Analysis


DISCLAIMER

This analysis site, as well as the analyses in it, is created for the sole purpose of education, discussion, fundamental analysis knowledge sharing, technical analysis knowledge sharing, funds flow analysis knowledge sharing, general skills-knowledge sharing and opinions sharing. The contents of this blog are not to be taken as investment advice or inducement to trade, and I take no responsibility for any gains or losses as a result of reading my analyses, judgements and opinions. In essence, practise due diligence. 

Monday, 28 January 2019

Technicals and Equity Dominant Money Flow / Dominant Order Flow of DBS Bank: 28 January 2019, Monday


Technicals and Equity Dominant Money Flow / Dominant Order Flow of DBS Bank: 
28 January 2019, Monday
(Click on Technical Chart above to Expand)

Attached is the Updated Technicals of DBS Bank with the associated last 2 weeks of Equity Dominant Money Flow (Dominant Order Flow) done by a fellow FFA practioner. The 2 red circled regions are the Super Cycle Resistance. The Green Circled Region is the Super-Cycle Resistance that had turned into Super-Cycle Support in tune with the Super Root of All Funds Flow. DBS has now refused to even back-test the blue circled region as support. This is a sign of strength in not only DBS Bank, but in Asian financial markets as well. Singapore economy will do so well in 2019 and 2020. DBS next target: $40.00 based psychological resistance and $53.42 based on Fundamentals-Logic (Super-Cycle) calculations as done previously.

【Do not follow the herd shouting for bear market or drawing bearish charts. 
We are at just mid-cycle of Secular Bull if you know your financial market knowledge well, especially global funds flow cycles】

 Funds Flow Analysis
Funds Flow Analysis


DISCLAIMER

This analysis site, as well as the analyses in it, is created for the sole purpose of education, discussion, fundamental analysis knowledge sharing, technical analysis knowledge sharing, funds flow analysis knowledge sharing, general skills-knowledge sharing and opinions sharing. The contents of this blog are not to be taken as investment advice or inducement to trade, and I take no responsibility for any gains or losses as a result of reading my analyses, judgements and opinions. In essence, practise due diligence. 

Thursday, 20 September 2018

Updated Technicals of DBS (Development Bank of Singapore): 20 September 2018, Thursday, 11.30am Singapore Time


Updated Technicals of DBS (Development Bank of Singapore): 
20 September 2018, Thursday, 11.30am Singapore Time
(Click on Technical Chart above to Expand)

Attached is the updated technicals for DBS (Development Bank of Singapore). Technical levels and forward projection (in brown trajectory) as illustrated on the chart itself. Study in detail to discover the genius with respect to timeline in each of the turns. DBS has strength, suggesting that smart monies' re-accumulated massive buys chalked up from January 2016 were not too much unloaded when institutions needed to adjust risk during the mid-term healthy correction. Market makers (strong hands) had been willing to support too based on volume flow. Based on the exchange-of-hands, without letting the price correcting down much, the implication is that the forward fundamentals of DBS remain robust.


Monday, 20 August 2018

DBS Bank: 20 August 2018, Monday, 7.59pm Singapore Time

DBS Bank: 
20 August 2018, Monday, 7.59pm Singapore Time
(Click on Technical Chart above to Expand)

Attached is the updated technicals for DBS Bank. The DBS Super-Cycle uptrend has now been delayed slightly by the current "trade-war spat" and the property cooling measure. The market is using the events to back-test the green support region ($20.00-$25.00) and the black support region to confirm the supercycle bull towards beyond $40.00 and $53.42. The expected trajectories are in dark orange and light orange respectively. The short term backtest does not derail the large uptrend. The technical price structure is one in which the critical super-cycle breakup got executed in 2017, and the critical backtest to confirm the supercycle bull got executed in 2018. 


Friday, 27 July 2018

FTSE ST Financial Index, DBS, UOB and OCBC: A Comparision, 27 July 2018, Friday, 8.55am Singapore Time


FTSE ST Financial Index, DBS, UOB and OCBC: A Comparision, 
27 July 2018, Friday, 8.55am Singapore Time
(Click on Technical Chart above to Expand)

Attached is the Technicals for FTSE ST Financial Index, DBS, UOB and OCBC. The FTSE ST Financial Index is used as the benchmark for comparison. The financial index whipsawed below the band of moving averages during this healthy correction. This correction caused the herd to read the market as all supports broken (naive reading) and caused them to exit the markets completely. Markets used this chance, when the 90% herd are out and most traders are shorting, to rally strongly. This will cause maximum damage to the herd.

During this correction, volumes were low meaning the stocks were passed from the weak mental strength herd to the hands of the smart monies. In the comparison analysis, DBS and UOB outperformed the benchmark financial index, refusing any whipsaw along the way. OCBC was on par with the benchmark and hence the weakest bank among the 3 Singapore Banks. DBS only gently touched the 200EMA showing why it had been the strongest bank among the 3 local banks in Singapore. If one is buying any bank stock and is spoilt for choice, then DBS is the top bank stock of Singapore.

Side-Note:
DBS Bank is the Top Stock of Entire Singapore SGX in The Donovan Norfolk Ranking of All Stocks.

Additional Note:
Worldwide bank stocks are expected to shoot through the roof in 2H-2018 and 2019. More waves of super rally in equity markets can be expected in 2H-2018, 1H-2019 and 2H-2019 -- amidst the backdrop of 80% market majority having the conviction of a bear market coming.

Important Cross-Reference:
http://donovan-ang.blogspot.com/2018/07/spdr-financial-select-sector-index.html


Saturday, 21 July 2018

Development Bank of Singapore (DBS): 21 July 2018, Saturday, 2.53pm Singapore Time

Development Bank of Singapore (DBS): 
21 July 2018, Saturday, 2.53pm Singapore Time
(Click on Technical Chart above to Expand)

Attached is the updated Technicals for Development Bank of Singapore -- The Donovan Norfolk Rated Top Stock of Entire Singapore SGX. The 3 dark green circled regions are my live calls in January 2016 to buy bank stocks all over the world, especially DBS Bank stocks. Singapore was to have technical recession back in 2016, 90% herd were selling cheaply at $12, calling me ridiculous to buy on bear market and forgotten my track records back then; only my fans and followers were buying. 

The double light green classical supports are the points of +100% profits for my early fans and followers who bought at $12.00-$13.00. They are sitting on +100% profits with 8%-10% dividend yields per annum. The smart monies are protecting these profits with the so many layers of supports as illustrated on chart, because DBS has fundamentals and is the top stock of entire Singapore SGX in my financial modelling.

The first green trajectory measures $10.50 on linear scale and +53% on logarithmic scale. This means the next wave of banks' super rally worldwide will bring DBS to $35.50 conservative target on the linear scale, and $38.00 logarithmic target on the logarithmic scale. DBS Bank may then rest slightly and proceed for $53.42 target using fundamentals-logic derived earlier. 

Reiterate:
DBS Bank is Ranked the Number 1 Top Stock of Donovan Norfolk for Entire Singapore SGX.

Side Note:
At target of $53.42, many of these early fans of Donovan Norfolk will have returns of +334% to +445% on DBS equities, with dividend yields of +8%-+10% per annum. Late fans of 2018 will still enjoy returns of +200% (+100% profits), with dividend yields of +4% per annum.

Additional Note:
Worldwide bank stocks are expected to shoot through the roof in 2H-2018 and 2019. More waves of super rally in equity markets can be expected in 2H-2018, 1H-2019 and 2H-2019 -- amidst the backdrop of 80% market majority having the conviction of a bear market coming.

Important Cross-Reference:
http://donovan-ang.blogspot.com/2018/07/spdr-financial-select-sector-index.html


Friday, 6 July 2018

Updated Technicals of Development Bank of Singapore (DBS): 6 July 2018, Friday, 12.59pm Singapore Time

Updated Technicals of Development Bank of Singapore (DBS): 
6 July 2018, Friday, 12.59pm Singapore Time
(Click on Technicals above to Expand)

Attached is the updated Technicals for DBS. The red circled regions are Super-cycle resistances. The first green circled region is where and when the Super-Cycle Uptrend Confirmation had been achieved for DBS Bank. Markets are currently using the supposed 2nd-ABSD property cooling and the supposed trade war to backtest the Super-Cycle Resistance-Turned-Support Band in Black. The 2nd green circled region is the backtest as shown by the blue trajectory. After this backtest, DBS is projected to hit $25.00+$17.50 = $42.50 based purely from technicals (refer chart to see the TA-mathematics). However, my expectation of DBS based on forward fundamentals and of the bank riding the digital tide well as a front-runner will mean that my $53.42 target staunchly remains. Shorting is high risk, buying and investing is low risk with high rewards. DBS is expected to follow the dark blue trajectory. 


Wednesday, 27 June 2018

Development Bank of Singapore (DBS): 27 June 2018, Wednesday, 11.25am Singapore Time

Development Bank of Singapore (DBS): 
27 June 2018, Wednesday, 11.25am Singapore Time
(Click on Technical Chart above to Expand)

Attached is the Updated Technicals for Development Bank of Singapore (DBS), the best bank in Asia-Pacific. Its technical structure is as follows: Long Term Uptrend; Mid Term Uptrend; Short Term Ichimoku Laggard Line backtesting Ichimoku Uptrend Cloud together with Tenkan-Kijun Pair backtesting the Forward Cloud as well (refer to all green circled regions). The volume was not enthusiastic during correction, meaning retail traders were shorting while smart monies were busy loading up at the buy queues using fear. A re-capture of $27.52 will spur a mother of all short squeezes -- people who traded counter-trend against the main uptrend (poor reward-risk ratio: one shall never short against strongest stock of entire SGX). I will put in 3 additional tranche of buys once (1) $27.52 gets taken out upwards (Tranche 1); (2)  $28.79 gets taken out upwards (Tranche 2); (3) $29.47 gets taken out upwards (Tranche 3). 


Wednesday, 20 June 2018

DBS Bank: 20 June 2018, Wednesday, 1.02pm Singapore Time

DBS Bank: 
20 June 2018, Wednesday, 1.02pm Singapore Time
(Click on Technical Chart above to Expand)

I am adding buys @ $26.99-$27.02


Tuesday, 19 June 2018

Straits Times Index & DBS Bank: 19 June 2018, Tuesday, 2.20pm Singapore Time

Straits Times Index: 
19 June 2018, Tuesday, 2.20pm Singapore Time
(Click on Technical Chart above to Expand)

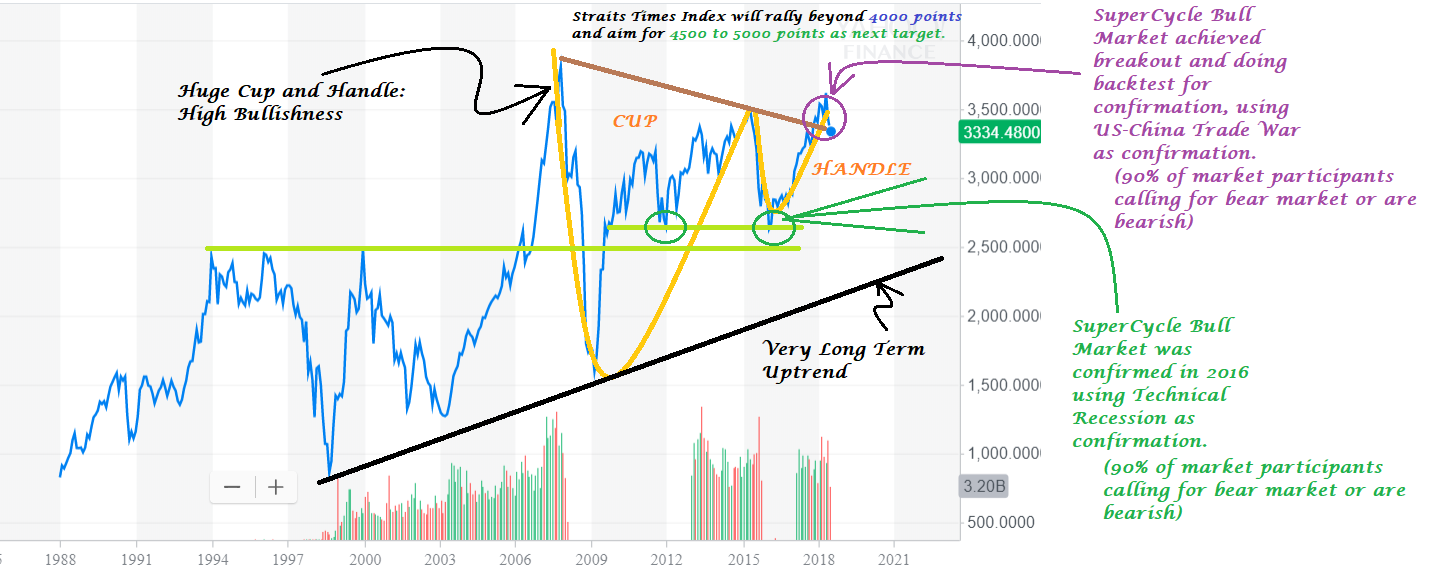
Attached is even more detailed technical explanations of the Singapore Straits Times Index. The green circled region pointed by the green arrow is the SuperCycle Bull Market confirmation made in 2016 -- using Technical Recession and extreme fear as confirmation of bull market (causing 90% market participants to be wrongly bearish back then and missing out on an almost +200% i.e. 2x move in DBS Bank, my top stock). Markets rallied after that per my precision forewarned rally. 

The Technical Price Structure in Orange is the Cup and Handle formation. It is large and it is bullish. It has broken up the neckline resistance in brown, meaning the markets are brewing for large scale upmove. The purple circled region is the Super-Cycle Bull Market achieving another breakup of resistance, a double confirmation of big bull market, and doing backtest of the brown neckline resistance-turned-support currently -- this time using US-China Trade War and extreme fear as confirmation of bull market (causing 90% market participants to be bearish just like in 2016 back then, meaning DBS Bank, my top stock, will move again another +200% i.e. 2x from here). We are currently in Super-Cycle Super Bull Market despite trade tensions between US and China.


Tuesday, 15 May 2018

DBS Bank Technical Update: 15 May 2018, Tuesday, 2.45pm Singapore Time

DBS Bank Technical Update: 
15 May 2018, Tuesday, 2.45pm Singapore Time
(Click on Technical Chart above to Expand)

Attached above is the Technicals for DBS Bank. DBS Bank is still doing a final back-test of support before we will never the equity price below $30.00 again. The next short term target is $33.26 based on the impulsive thrust of April 2018. This short term target move towards $33.26 is part of a long term move towards $54.32 -- the first real shot at the long term target price. The second long term target price is $100.00.

Past Analyses of DBS Bank
(the most insightful and the most in-depth you can ever get):
http://donovan-ang.blogspot.sg/search/label/DBS

Thursday, 10 May 2018

DBS Bank Technical Update Two: 10 May 2018, Thursday, 10.45pm Singapore Time

DBS Bank Technical Update Two: 
10 May 2018, Thursday, 10.45pm Singapore Time
(Click on Technical Chart above to Expand)

Markets continue to have induced a lot of retailer shorts and retailer sells. 
Markets are flooded with rampant DBS shorts/sells.
A whip on shortists using an abrupt soaring will continue to be brewed nicely. This will be served as a deliciously thick frothy whipped cream. 

The technicals for DBS remain of bullish bias. Real volatility is towards the upside and not downside.
Uptrend strength is intact. More up-moves coming.

Yesterday's DBS Technical Update One as attached below:
http://donovan-ang.blogspot.sg/2018/05/dbs-bank-technical-update-9-may-2018.html

Wednesday, 9 May 2018

DBS Bank Technical Update: 9 May 2018, Wednesday, 2.48pm Singapore Time

DBS Bank Technical Update: 
9 May 2018, Wednesday, 2.48pm Singapore Time
(Click on Technical Chart above to Expand)

Markets have induced a lot of retailer sells and retailer shorts. 
Markets are now flooded with rampant DBS shorts/sells.
A whip on them with a violent soar up will be the whipped cream to be served, deliciously creamy. 

The technicals for DBS remains of strong bullish bias.
Uptrend strength is strong and remains strongly intact.

Additional Intraday Charts as below:
DBS Bank Technical Update: 
9 May 2018, Wednesday, 2.48pm Singapore Time
(Click on Technical Chart above to Expand)

【I'm Rubbing Palms to Kill Short-Sellers: Deliciously Creamy】

Tuesday, 8 May 2018

DBS Bank: 8 May 2018, Tuesday, 9.36am Singapore Time

DBS Bank: 
8 May 2018, Tuesday, 9.36am Singapore Time
(Click on Technical Chart above to Expand)

Attached above is the Technicals for DBS Bank. It has entered into the green buy on dip zone. DBS Bank remains bullish. The technical price structure is as follows: 
Long Term: Bullish (Uptrend)
Mid Term: Bullish (Uptrend)
Short Term: Bullish (Uptrend)
Immediate Term: Correction (comeback boat for joining the uptrend)
Overall: Bullish


Thursday, 26 April 2018

Development Bank of Singapore (DBS): 26 April 2018, Thursday, 1.28pm Singapore Time

Development Bank of Singapore (DBS): 
26 April 2018, Thursday, 1.28pm Singapore Time
(Click on DBS Statistics and Illustration above to Expand)

Attached above is the rugged Statistics, Pattern Recognition, Geometric Series Projection and Graphic Projection Illustration for DBS Bank on a linear chart. The above is in tune to the standard trajectory of a titan-in-the-making riding on a major secular cycle by being in the right place at the right time doing the right things (refer to past precedents such as Amazon, Cheung Kong Holdings, Coca-Cola, Dow Jones Industrial, etc). DBS Bank's growth, profits, dividends and earnings growth prospects has so far been following a Geometric Series Progression (ignoring 2009 data as outlier/noise due to US Subprime Crisis). Recently DBS has broken the exponential neck in both earnings (profits) and dividends with the bull market merely at its 50th-percentile mark. This is a real break in the geometric neck.

Based on my judgement, DBS Bank will become a true wealth cash cow with dividends all re-invested for compounding effects. $53.42 target price is a minimum target as derived by previous fundamentals-logic induction. A low end of $100.00 Target Price can be reasonably expected in the current Secular Cycle (Secular Cyclic Theme: Super-Cycle of Asia & Banking Needs of Asia) following a standard exponential trajectory after an exponential neck break (similar to Amazon, Cheung Kong Holdings, Coca-Cola, Dow Jones Industrial, etc), with median of $250.00 as the first real shot on TP under the current Secular Super-Cycle (2018-2038).

Reiterate: stocks following a standard exponential trajectory after an exponential neck break included Amazon, Cheung Kong Holdings, Coca-Cola, Dow Jones Industrial, etc, and DBS Bank will be the next such classic power-x.

These variables are likely to be the contributing factors for DBS trending towards the orange zone trajectory:

1. Banking and Finance tide under the new normal of rising rates environment.
2. Rising asset prices.
3. Asia's Secular Bull Super Cycle.
4. The acceleration of South East Asia, and its associated ASEAN bloc, towards becoming a truly economic powerhouse.
5. Digitisation and Innovation: DBS is the most active embracer of digitisation and the development of digital bank presence. This, to me, is the most important X-Factor.

Possible other factors:
6. Trans-Pacific Partnership (TPP) further opening up international trade and finance (and of course loans and borrowings and more businesses)
7. China may open up more and employ even more free-market mechanism.
8. Malaysia approaching towards 1st world status
9. Indonesia achieving the all critical neck-break in GDP per capita and accelerated growth.


The Donovan Norfolk Rating:
Highly Bullish
(Strongest stock in entire Singapore SGX)

Past DBS Analysis:
http://donovan-ang.blogspot.sg/search/label/DBS


Illustrations Further Enlarged as Below:

Development Bank of Singapore (DBS): Geometric Series 1:
26 April 2018, Thursday, 1.28pm Singapore Time
(Click on DBS Statistics and Illustration above to Expand)

Development Bank of Singapore (DBS): Geometric Series 2:
26 April 2018, Thursday, 1.28pm Singapore Time
(Click on DBS Statistics and Illustration above to Expand)
(Ignore 2009 data as outlier/noise due to the US Subprime Crisis)

Development Bank of Singapore (DBS): Geometric Series 3:
26 April 2018, Thursday, 1.28pm Singapore Time
(Click on DBS Statistics and Illustration above to Expand)

Development Bank of Singapore (DBS): Geometric Series Projection:
26 April 2018, Thursday, 1.28pm Singapore Time
(Click on DBS Statistics and Illustration above to Expand)


Saturday, 24 March 2018

Funds Flow Analysis of DBS Bank: 24 March 2018, Saturday, 1.53pm Singapore Time

Funds Flow Analysis of DBS Bank: 
24 March 2018, Saturday, 1.53pm Singapore Time
(Click on FFA Chart above to Expand)

Attached is the updated Funds Flow Analysis (FFA) for DBS Bank. All illustrations are as per on FFA chart. Based on the funds flow, retailers and fools' monies appear to be the ones shorting and selling the market and not smart monies. In addition, every time after DBS touches into the white support band area, it will absorb all retailers' selling and propel impulsively upwards for new highs (shake out, take in, and bulldoze -- shake, take, bull)