Ticker 1

Ticker 2

Click "Like" to Receive First Hand Updates From The Analysis Site / Click "SHARE" to share

Showing posts with label Wilmar. Show all posts

Sunday, 29 December 2019

Wilmar International: 29 December 2019, Sunday

Updated Technicals of Wilmar International:
29 December 2019, Sunday
(Click on the Technical Chart Above to Expand)

Attached is the Updated Technicals of Wilmar International. The entire yellow circled region was forewarned by me, before prices moved, that Palm Oil and good palm oil stocks worldwide, such as Wilmar, will make a great bullish rounding bottom for a super rally. When most people were gloom and doom on palm oil, I turned into high optimism. In the middle of this year 2019 and reiterated in 3Q-2019, I had said that palm oil was going to have extreme rally, and it is all happening now, true to my words (refer to past live track records as attached below). Wilmar will challenge for $7.11 long term technical resistance in the resumed cycle for palm oil, and is expected to break up $7.11 resistance like a hot knife cutting through butter.

The Donovan Norfolk Technical Rating:
Bullish

Past Wilmar Analyses:
http://donovan-ang.blogspot.com/search/label/Wilmar

DISCLAIMER

This analysis site, as well as the analyses in it, is created for the sole purpose of education, discussion, fundamental analysis knowledge sharing, technical analysis knowledge sharing, funds flow analysis knowledge sharing, general skills-knowledge sharing and opinions sharing. The contents of this blog are not to be taken as investment advice or inducement to trade, and I take no responsibility for any gains or losses as a result of reading my analyses, judgements and opinions. In essence, practise due diligence. 

Tuesday, 23 July 2019

Updated Technicals of Wilmar International: 23 July 2019, Tuesday


Updated Technicals of Wilmar International:
23 July 2019, Tuesday
(Click on the Technical Chart Above to Expand)

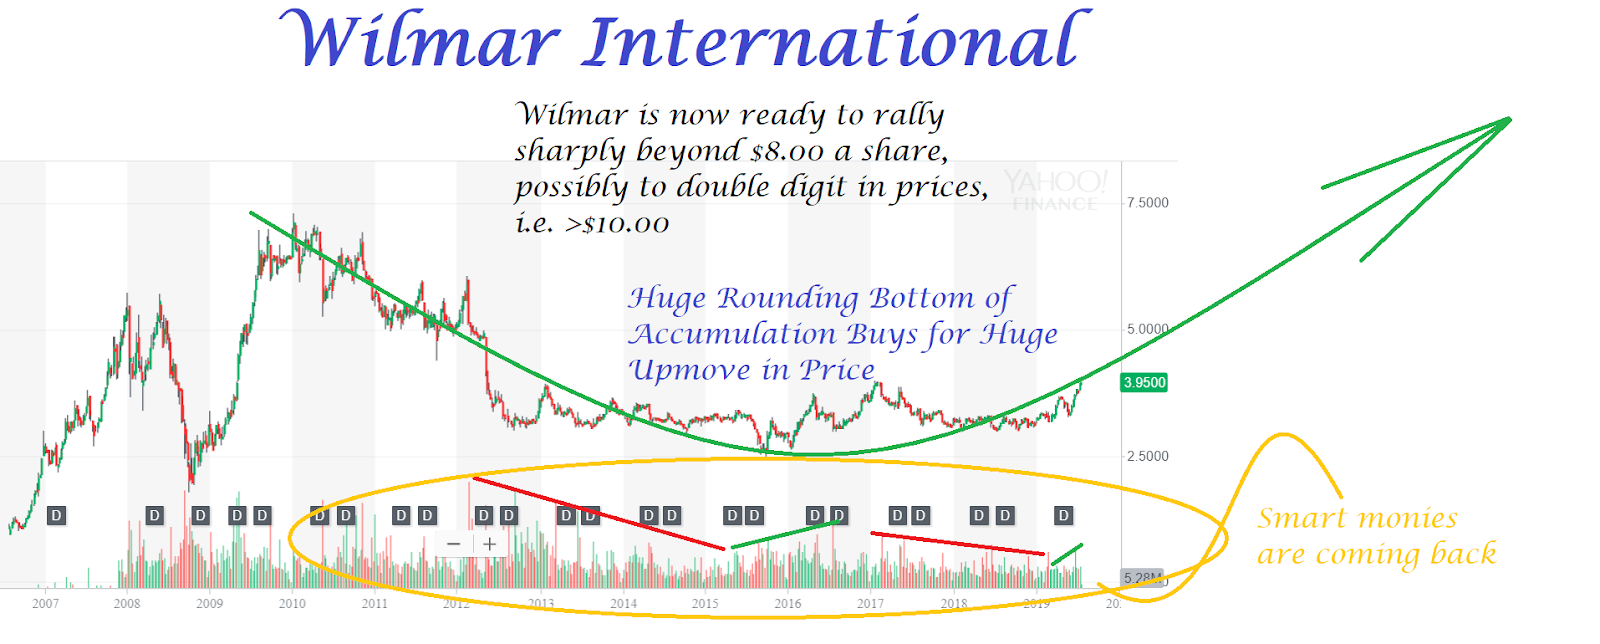
Attached is the Updated Technicals of Wilmar International. Wilmar has completed the huge rounding bottom of massive accumulation. This is a brew for very large wave up. Palm oil and palm oil stocks worldwide are looking at this industry leader closely too. Wilmar is now ready to rally big time to way beyond $8.00 a share -- possibly to double digit in prices, i.e. >$10.00 a share. Only a rally to beyond $10 a share will make the huge massive accumulation (See Volume Flow in Chart) worth it.

The Donovan Norfolk Technical Rating:
Bullish


DISCLAIMER

This analysis site, as well as the analyses in it, is created for the sole purpose of education, discussion, fundamental analysis knowledge sharing, technical analysis knowledge sharing, funds flow analysis knowledge sharing, general skills-knowledge sharing and opinions sharing. The contents of this blog are not to be taken as investment advice or inducement to trade, and I take no responsibility for any gains or losses as a result of reading my analyses, judgements and opinions. In essence, practise due diligence. 

Sunday, 18 November 2018

Updated Technicals of Wilmar International: 18 November 2018, Sunday, 2.35pm Singapore Time

Updated Technicals of Wilmar International: 
18 November 2018, Sunday, 2.35pm Singapore Time
(Click on Technical Chart above to Expand)

Attached is the Updated Technicals for Wilmar International, a major palm oil company that is listed in the Singapore SGX. Wilmar is currently still doing a large rounding bottom of re-accumulation. The first 3 dark orange circled regions are where extreme high volumes could not crush Wilmar -- these are secret buying volumes by smart monies in the market. The 4th orange circled region is confirmation on buying volumes. Wilmar's current big rounding accumulation coincides with where the worst of all trade war fears merely confirmed a large higher low. It is a confirmation of its long term bull market. Expectation of Wilmar's forward trajectory is as illustrated on chart.

The Donovan Norfolk Technical Rating:
Long Term Bullish within Bull Market

Tuesday, 3 July 2018

Wilmar International: 3 July 2018, Tuesday, 2.28pm Singapore Time

Wilmar International: 
3 July 2018, Tuesday, 2.28pm Singapore Time
(Click on Technical Chart above to Expand)

Attached is the Technicals for Wilmar International that is listed in the Singapore SGX. Wilmar is currently doing a large rounding bottom of re-accumulation. The Inverse Shoulder-Head-Shoulder in play (illustrated in brown) is helping to propagate fear, with success as well. The price structure is a large price structure of uptrend.  

The Donovan Norfolk Technical Rating:
Long Term Bullish within Bull Market

Saturday, 10 March 2018

Wilmar International: 10 March 2018, Saturday, 2.28pm Singapore Time

Wilmar International:
10 March 2018, Saturday, 2.28pm Singapore time
(Click on Technical Chart Above to Expand)

Attached above is the technicals for Wilmar International that is listed in the Singapore SGX.
The orange circled regions illustrate step by step how Wilmar had slowly and quietly made use of the past 2 years to build and confirm its long term uptrend. Wilmar is currently at its mid-long term bottom area again. Wilmar will have to rally all the way from here now to break up $4.00 long term resistance. This is to maintain its long term uptrend momentum. Probability of success in doing that is a high 85%. Bullish, provided the OBV does not break down. Selling has been dry. Bullish volumes will flood back into commodity stocks worldwide again from March 2018 to December 2018. Agriculture, plantation and commodities winter are over, and in spring period as a cyclic cycle now.


Wednesday, 7 December 2016

Wilmar International: a Fortune Global-500 List of Blue Chip Companies

Wilmar International: a Fortune Global-500 List of Blue Chip Companies

Attached above is the technicals for Wilmar International that is listed in the Singapore SGX.
Wilmar International is one of the largest palm oil companies in the world and is a Fortune Global-500 blue chip company.

The green regions are my live warnings in February-2016 and July-2016 to buy Wilmar, Palm Oil, Commodities and Commodity Stocks as much as possible, fore-warning a massive uptide in commodities and commodity stocks to come in 2H-2016 and 2017.

The black regions are my live warnings in early 2016 that all red bearish-looking volume bars are to be interpreted as secret buys by smart monies (and to shake out retailers, traders and investors who interpret volumes naively).

The yellow regions denote how one should currently interpret the market: 
having armed with so much volumes on smart money hands, the upside continues to be tremendous for 2017.

Track Records (All past forewarned analyses as attached below):

Additional Note:
Per forwarned since 2H-2015 on Palm Oil having high upside before it moves, palm oil prices has since moved up significantly. However, future upside continues to be significant.
Worldwide financial markets: continue to be bullish bias.

Monday, 4 July 2016

Wilmar International: 4 July 2016, Monday, 7.33am Singapore Time

Wilmar International: 
4 July 2016, Monday, 7.33am Singapore Time

Attached above is the Technical Analysis of Wilmar International, a stock that is listed in the Singapore SGX.

1. Long term breakup
2. High Volume breakup, and any retailers' selling are absorbed by smart monies
3. Ignored Brexit fear. Buy on Brexit fear.
4. Bullish Pink Wedge
5. Currently at confluence of three powerful supports (pink, blue and yellow supports)
6. Expected to rally for the rest of 2016 and 2017.
7. Any red bearish-looking high volume bars that come are actually buys from smart monies (and to shake out retailers, traders and investors who interpret volumes naively)

Donovan Norfolk Technical Rating:
Bullish
Expected to rally for the rest of 2016 and 2017.


Thursday, 18 February 2016

Wilmar Technical Analysis: 18 February 2016, Thursday, 3.51pm Singapore Time

Wilmar Technical Analysis: 
18 February 2016, Thursday, 3.51pm Singapore Time

Attached above is the technical analysis of Wilmar, a Singapore listed palm oil company.
It is a typical representation of how palm oil, palm oil companies and commodities may execute a larger-wave dead cat bounce yet still be entrenched within a very long term bear market.

Such moves typically make stock buyers excited thinking of bull market. It is meant to add noise to the market since most people do not know what is going on in the market and are easily distorted by less macroscopic moves.


Monday, 20 July 2015

Wilmar: 20 July 2015, Monday, 3.12pm Singapore Time

Wilmar: 20 July 2015, Monday, 3.12pm Singapore Time

Wilmar the palm oil (commodity) stock.

Commodities and commodity stocks will rally worldwide on raising of interest rates by the US Federal Reserve. The rally on commodities and commodity stocks will be against all logic but will happen. Rub your palms for this commodities-themed rally that is coming when everyone expects USD to rise on FED rising of interest rates.

Donovan Technical Rating:
Strong Buy for Commodities and Commodity Stocks
Strong Buy on Wilmar
Click "Share" on the Facebook icon at the bottom of this thread if you like it, or 
if you would like to start a discussion about it with friends on your Facebook Wall.

Wednesday, 11 June 2014

Wilmar International: 11 June 2014, Wednesday, 2.17am Singapore Time

Wilmar International: 11 June 2014, Wednesday, 2.17am Singapore Time
Chart courtesy of Chartnexus.com

<< WARNING: Failure To Rebound on MAXIMUM +10.000 FFA >>
+ Maximum +10.000 FFA in the big wind/broad market is completing and U-turning, and this had been the best performance that this stock can offer (to be trapped within bearish triangle within a +10.000 FFA: clear intentions to break down big time).
+ Resumption in sell-off will now proceed to do further damage.
+ Financial markets are transiting to bear markets as per warned beforehand in Daily Funds Flow Analyses.
Corrective wave is ending for resumption of the Major Down Wave.

Donovan Norfolk Technical Rating:
End of Consolidation with many retailers trapped
Bearish
(Sell on Rebounds)


Donovan Norfolk Ang

Click "Share" on the Facebook icon at the bottom of this thread if you like it, or 
if you would like to start a discussion about it with friends on your Facebook Wall.

Thursday, 5 June 2014

Crude Palm Oil (CPO): 5 June 2014, Thursday, 4.15pm Singapore Time

On 31st August 2013, Donovan Norfolk Ang's Market Analysis for Crude Palm Oil was (I quote):
"1. short-mid term movement of FCPO will be very bullish in 2013 until the target 2750-3000 is to be hit
2. Movement from longing point of 2410 RM towards the 3000 RM represents a potential profit of +24.5% without leverage, and a profit potential of +245.0% with a 10x leverage.
3. Such a movement was consistent with worldwide funds flow analysis of all financial markets that Big Hands and Smart Monies were longing and buying for rebounds."

Refer:

All these long/buy targets had hit target with profits all taken off the table (triggered) and I had turned short/sell from the 3000 RM longs-profit-triggered target. After being bullish and making the big jackpot, I am turning short for the downside jackpot.

The following MONTHLY, WEEKLY AND DAILY Chart of Crude Palm Oil
shows you what is happening in the Crude Palm Oil markets as well as a display of all my track records.


Crude Palm Oil (CPO) Monthly Chart:
5 June 2014, Thursday, 4.15pm Singapore Time

Note that Crude Palm Oil is currently under long term suppression and is entrenched in a very long term bear market. A lot of resistances illustrated above, especially the Long Term Bear Market Enforcement Zone in LUMINOUS GREEN, is ensuring this very long term bearish downtrend.

A sufficiently powerful classical resistance as denoted by the three red "SUPPRESS" in the chart above is further capping the CPO market.

All palm oil commodities stocks to be suppressed.
refer as example recent palm oil commodities stocks' analyses:

Crude Palm Oil (CPO) Weekly Chart:
5 June 2014, Thursday, 4.15pm Singapore Time

CPO also has a long term distribution shoulder-head-shoulder as above. 
This entire formation means that 1720 will be tested as the next support, and that 1720 region will be hit. 
This represents a further heavy -26.9% downside from current point.


Crude Palm Oil (CPO) Daily Chart:
5 June 2014, Thursday, 4.15pm Singapore Time

The above illustrates the resumption of long term downtrend once the price satisfaction zone as determined in August 2013 was hit in March 2014.

From chart above, Crude Palm Oil is guaranteed to break down multi-year low of 2137RM for a new multi-year low.

Donovan Norfolk Ang Technical Rating:

Stocks expected to be bearish during this FCPO Technical Long Term Downtrend Resumption:
Very Bearish on Palm Oil Stocks such as 
Wilmar, Golden Agri, Kencana Agri, First Resources etc
Bearish also on commodities stocks in general.

Bearish also on AUDUSD and NZDUSD.
Bullish on USDCAD.
(That is, bearish on commodities currencies: Aussie Dollar, New Zealand Dollar and Canadian Dollar)


Donovan Norfolk Ang

Click "Share" on the Facebook icon at the bottom of this thread if you like it, or 
if you would like to start a discussion about it with friends on your Facebook Wall.

Saturday, 29 March 2014

Wilmar: 29 March 2014, Saturday, 12.10pm Singapore Time

Wilmar (Commodity Stock): 29 March 2014, Saturday, 12.10pm Singapore Time

Wilmar's, as well as commodity stocks', current position coincides with AUDUSD the commodity currency's critical position for bearish reversal. See AUDUSD Chart below.

AUDUSD: 29 March 2014, Saturday, 12.10pm Singapore Time

The AUDUSD chart shows the critical area of multiple resistances suppressing the commodities family. This all falls into place synchronously. The markets are very highly in sync. That is also why the Aussie Dollar (AUDUSD) was weirdly bearish on Friday. It is because everything has to be in synchronous mode, like the harmonics of a perfect orchestra.

Donovan Norfolk Ang Technical Rating:
Bearish
(Sell/Short at the Zones above)
(Bearish also on all international stocks and equities)


Click "Share" on the Facebook icon at the bottom of this thread if you like it, or 
if you would like to start a discussion about it with friends on your Facebook Wall.
Sunday, 17 March 2013

Wilmar International: 17 March 2013, Sunday, 6.10pm Singapore Time

The following Technical Analysis and judgements is an update on Wilmar International 
(refer all past Technical Analysis posts of Wilmar here: http://donovan-ang.blogspot.sg/search/label/Wilmar)

Wilmar International: 17 March 2013, Sunday, 6.10pm Singapore Time

Wilmar had a break up as anticipated beforehand (refer all past posts of Wilmar here: http://donovan-ang.blogspot.sg/search/label/Wilmar). 

The initial break-up (BLUE CIRCLE) was with healthy volume following which it started to decrease and became a volumeless rally. PINK Support of $3.595 breaking down signifies end of its short term rally.

The 3 RED CIRCLES signify warning signs that short-selling may come back on Wilmar and it is better to sideline away from any longs on Wilmar based on Technical Structure above.

Two Immediate Scenarios will form now:

Scenario 1: Dead Cat Bounce to $3.595 before full sell-down to break down BLACK SUPPORT.
Scenario 2: Straight-away break down BLACK SUPPORT mercilessly without any chance given.

When BLACK SUPPORT breaks down, the selling which forces down prices could be fierce.
Given the Technical Posture above in the latest development, I expect BLACK SUPPORT TO BREAK DOWN.

HOME:

Wednesday, 19 December 2012

Wilmar International: 19 December 2012, Wednesday, 5.03pm Singapore Time


I am now retracting my risk-off analysis on Wilmar, and am back to high bullishness on Wilmar.

This is because Big Hands' risk-on are back according to my Funds Flow Analysis, and that Wilmar, together with Olam and Noble Group which are in the same commodities sector, will be back on track for rallies. 

Hence my anticipation of a break up on Wilmar will stand. 

It is still very cheap to get back in on Wilmar as it has not officially broken up yet and upside is high.


Donovan's Market Analysis: 

Saturday, 24 November 2012

WILMAR: 24 November 2012, Saturday, 1.20pm Singapore Time

WILMAR: 24 November 2012, Saturday, 1.20pm Singapore Time

Above attached is the Technical Analysis of Wilmar International. 

For the entire 2012, I have been extremely bearish of Wilmar, always calling for a SHORT on this stock even before I started the "DONOVAN'S MARKET ANALYSIS" site. However, I am reversing my judgement on Wilmar after its consolidation for 4 months.

Wilmar LONGS is in tally with my BIG MARKET Funds Flow Analysis as big hands are longs in the big markets.

The above YELLOW shaded region represents a consolidation to reverse the trend and attack upwards now. $3.12-$3.15 represents good entry opportunities with stop-loss at just below $3.00.

Upside is as high as $4.68 (1st target) and $5.60 (2nd target) or when Funds Flow Analysis indicates a sell, whichever is earlier.

Overall, Donovan View on Wilmar:
BUY with Cautions

Note:
I am also reversing from Bearish mode into Bullish mode for worldwide markets in the short term now (Indices, Stocks, Big Directions, Euro).