Ticker 1

Ticker 2

Click "Like" to Receive First Hand Updates From The Analysis Site / Click "SHARE" to share

Wednesday 28 November 2018

Weekly Chart of Alibaba Group Holdings (NYSE: BABA): 28 November 2018, Wednesday, 8.38pm Singapore Time

Weekly Chart of Alibaba Group Holdings (NYSE: BABA): 
28 November 2018, Wednesday, 8.38pm Singapore Time
(Click on Technical Chart above to Expand)

Attached is the weekly chart technicals for Alibaba Group Holdings that is listed in the US Market (NYSE: BABA). Alibaba share prices is acting in accordance to the technicals of how a strong stock should be. In the weekly technicals, RSI of 30-35 never fails to re-start a rally on Alibaba, and the rally has always been significant. This happens because Alibaba is a strong company and smart monies like this company. Alibaba has hit such an RSI again at 30-35, and the volume flow is bullish now. Any high red volume bars are quickly negated by high green volume bars suggesting there was a lot of selling absorption (transfer of hands from plenty of weak minded fearful retailers to strong mental strength smart monies). 

Past Alibaba Analyses:
http://donovan-ang.blogspot.com/search/label/Alibaba

Wednesday 21 November 2018

Steel: 21 November 2018, Wednesday, 4.59pm Singapore Time

Steel: 
21 November 2018, Wednesday, 4.59pm Singapore Time
(Click on Technical Chart above to Enlarge)

Attached is the Technicals for Steel. The Green Circled Region is my live fore-warning back in 2016 that Steel prices would rock bottom in 2016 and that the region will be the launch of Secular Cycle Wave Up, especially for hard commodities such as Steel and its supplementary association -- Coaking Coal. Steel rallied after my buy call point. In end-2017, it made a defining pivot at 4750 Yuan per MT. In entire 2018, Steel was supposed to be one of those commodities to be hit by the so called infamous "Trade War" between US and China, but 95% market herd did not even realise that Steel Prices were unaffected at all -- not even the slightest pinch of ant's bite. Current Economic Cycle's Minimum Target Price for Steel is 9500 Yuan per MT (refer calculations on chart). The Expectation Target Price is 14,250 Yuan per MT. This marks a +633% returns from my buy point and +317% from current point). Bullish on Steel and Steel Stocks.

iPath S&P500 VIX Short Term Futures ETN (NYSE: VXX): 21 November 2018, Wednesday, 10.04am Singapore Time

iPath S&P500 VIX Short Term Futures ETN (NYSE: VXX): 
21 November 2018, Wednesday, 10.04am Singapore Time
(Click on Technical Chart above to Enlarge)

While collecting mid term and long term quality stock buys, there may be some need to hedge oneself slightly in the short term with some VIX or index options. Attached is the iPath S&P500 VIX Short Term Futures ETN (NYSE: VXX). When stock market indices go down, VXX spikes up in the short term. The projected target for VXX is $48.75. Take profits of the hedges at $48.75 region. 

Tuesday 20 November 2018

Malaysia Steel Works (MASTEEL) (KLSE: 5098): 20 November 2018, Tuesday, 2.20pm Singapore Time


Malaysia Steel Works (MASTEEL) (KLSE: 5098): 
20 November 2018, Tuesday, 2.20pm Singapore Time
(Click on Technical Chart above to Enlarge)

I am officially adding significant positions in Malaysia Steel Works (MASTEEL) now after 1st initial torpedo in early 2018. The black structure is the 10-Year SuperCycle Bullish Wedge that will result in Super-Cycle Bull of a Lifetime. As reiterated that 2008-2018 is 1st half of secular bull, with 2018-2028 making up 2nd half of the secular bull, the green circled region is the SuperCycle breakout. The brown circled region is the SuperCycle's treacherous backtest of a lifetime to confirm for SuperCycle's Bull of a Lifetime. Refer to detailed calculations on Chart. MASTEEL can be expected to hit a minimum TP of 2.7600 from current price of 0.4800, and has an expectation TP of 3xPivot= RM 4.14 (Current Price RM0.48).

【Do not follow the herd shouting for bear or drawing bearish charts cluelessly】

The Current State of Steel (Major Steel and Steel Stocks Rally Expected Ahead): 20 November 2018, Tuesday, 10.12am Singapore Time


The Current State of Steel (Major Steel and Steel Stocks Rally Expected Ahead): 
20 November 2018, Tuesday, 10.12am Singapore Time
(Click on Technical Chart above to Expand)

Attached is the Technicals of VanEck Vectors Steel as a litmus for the Current State of Steel. The entire 2018 had been used for massive re-accumulation of commodities. Steel is one of them. The bullish descending wedge spanning 2018, which is supposed to create massive bearishness among the naive herd, is going to complete soon. When it completes, Steel and Worldwide Steel Stocks will resume the next big wave up in 2019-2020.

【Do not follow the herd shouting for bear or drawing bearish charts cluelessly】

Sunday 18 November 2018

The True Picture of Yangzijiang Shipbuilding: 18 November 2018, Sunday, 5.27pm Singapore Time

The True Picture of Yangzijiang Shipbuilding: 
18 November 2018, Sunday, 5.27pm Singapore Time
(Click on Technical Chart above to Expand)

1. As reiterated, 1st half of the bull market runs from 2008-2018 and 2nd half of bull market runs from 2018-2028. Mid point of secular bull: 2018 (for conviction shakeouts)
2. Yangzijiang has consolidated in a large symmetrical triangle and has broken up the triangle of 2008 to 2018; we are now entering into 2nd half of the secular bull market where majority gains are to be made. With the backtest in 2nd green circle, expect Yangzijiang to break up $2.70 historical high and go for breakup of $3.00 psychological resistance.
3. You can be sure 95% herd are either bearish, calling for bear market, calling recession and calling for crisis. We are in super-cycle bull market of a life time. 

【Don't be a fool and follow the herd shouting for bear or drawing bearish charts-- cluelessly like a headless chicken.】

Updated Technicals of Wilmar International: 18 November 2018, Sunday, 2.35pm Singapore Time

Updated Technicals of Wilmar International: 
18 November 2018, Sunday, 2.35pm Singapore Time
(Click on Technical Chart above to Expand)

Attached is the Updated Technicals for Wilmar International, a major palm oil company that is listed in the Singapore SGX. Wilmar is currently still doing a large rounding bottom of re-accumulation. The first 3 dark orange circled regions are where extreme high volumes could not crush Wilmar -- these are secret buying volumes by smart monies in the market. The 4th orange circled region is confirmation on buying volumes. Wilmar's current big rounding accumulation coincides with where the worst of all trade war fears merely confirmed a large higher low. It is a confirmation of its long term bull market. Expectation of Wilmar's forward trajectory is as illustrated on chart.

The Donovan Norfolk Technical Rating:
Long Term Bullish within Bull Market

The True Picture of Olam International, reflection of Global Commodities Market: 18 November 2018, Sunday, 11.30am Singapore Time

The True Picture of Olam International, reflection of Global Commodities Market: 
18 November 2018, Sunday, 11.30am Singapore Time

Today, I am going to point out certain facts (Universal Truths) about Olam:

1. As reiterated, 1st half of the bull market runs from 2008-2018 and 2nd half of bull market runs from 2018-2028
2. Olam has consolidated in a large symmetrical triangle during the first half of the bull market from 2008 to 2018, and 2nd half of the bull market is where majority gains are to be made.
3. Olam is on SuperCycle support right now. It is expected to follow either trajectory path 1 in green or path 2 in red. Path 2 represents a fake breakdown followed by real breakup, while Path 1 is a more simple rebound and breakup.
4. As 2018 has caused sentiments among retailers and ignorant fools to be bearish beyond doubt among them, 2018 has now proven to be a mid point of the 2008-2028 secular term bull market. This is in sync with secular economic cycles which I had taught all along in 2018.


Wednesday 14 November 2018

Technical Analysis of Tractor Supply Company (NASDAQ: TSCO): 14 November 2018, Wednesday, 10.55pm Singapore Time

Technical Analysis of Tractor Supply Company (NASDAQ: TSCO): 
14 November 2018, Wednesday, 10.55pm Singapore Time
(Click on Technical Chart above to Expand)

Attached is the Chart Technicals for Tractor Supply Company (NASDAQ: TSCO). It has completed an expanding triangle for high beta strong upmove. Expanding triangles which break out to the upside will often yield high price moves up. The volume flow tallies with strong smart money funds inflow. Bullish. Buy.


Technical Analysis of Pfizer (NYSE: PFE): 14 November 2018, Wednesday, 7.37pm Singapore Time


Technical Analysis of Pfizer (NYSE: PFE): 
14 November 2018, Wednesday, 7.37pm Singapore Time
(Click on Technical Chart above to Expand)

Attached is the Chart Technicals for famous drug-maker Pfizer (NYSE: PFE). Pfizer is currently for short-selling. Pfizer is demonstrating a bullish rounding chart pattern, but it had been seeing funds outflow and had flipped into a short term funds outflow stock while bullish chart pattern was being formed. This is when funds flow on the stock takes priority over technical analysis. Expect retailers in the market to be killed (brilliant set-up). Expect $41.50 support to break down. Take profits of shorts after $41.50 breaks down. There is a good chance Pfizer would like to back-test the mid point of 50MA and 200MA or at the deepest -- 200MA as backtest of support.


Tuesday 13 November 2018

Technical Analysis of General Electric (NYSE: GE): 13 November 2018, Tuesday, 11.18am Singapore Time

Technical Analysis of General Electric (NYSE: GE): 
13 November 2018, Tuesday, 11.18am Singapore Time
(Click on FFA Chart above to Expand)

Attached is Technicals of General Electric (NYSE: GE). Following my Funds Flow warning that smart monies were selling and shorting GE long term in early 2018, GE is indeed relentless in its collapse in price. One should still hold on to one's GE Shorts. As reiterated and maintained, this short-selling trade has got to be the best hedge for one's portfolio of longs/investments. Target price remains at $1.00, as maintained previously when GE was way above $10.00. This represents a -90% drop in prices. Maintains that GE is a highly profitable strong short-sell on rebound (Hedge longs using GE shorts). 

Previous Funds Flow Analysis of General Electric:


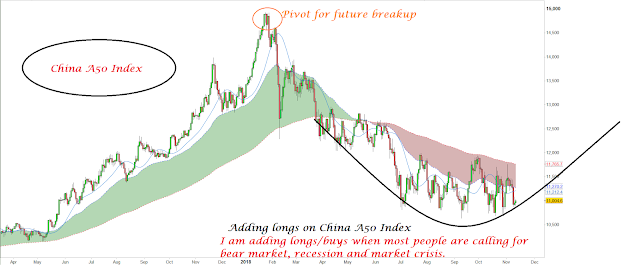
China A50 Index: 13 November 2018, Tuesday, 10.30am Singapore Time


China A50 Index: 
13 November 2018, Tuesday, 10.30am Singapore Time
(Click on Technical Chart above to Expand)

After taking profits of all my China Shorts,
I am adding again some buy position on China -- China A50 Index Longs.
I am chalking up longs/buys when most people are calling for global bear market, recession and market crisis.

Thursday 8 November 2018

The True Picture of Singapore Stock Market, best reflection of Global Economic Health: 8 November 2018, Thursday, 11.22am Singapore Time


The True Picture of Singapore Stock Market, best reflection of Global Economic Health: 
8 November 2018, Thursday, 11.22am Singapore Time
(Click on Technical Chart above to Expand)

Today, I am going to point out certain facts (Universal Truths) about Singapore Stock Market:
1. The Singapore Stock Market is at the internal blue trend band support within the black super-cycle channel.
2. We have already back-tested the green classical support band twice in the past 10 years. This back-testing made up the 1st half of a SuperCycle Bull (2008-2018).
3. The next 2nd half of the SuperCycle Bull (2018-2028) will see Straits Times Index (STI) rally to 6000 points and beyond (Purple Trajectory). This means all the blue chips have +100% to +500% profit upside to go, mid caps have +500% to +1000% upside, and small caps have +1000% to +5000% upside, if we base on previous bull market cycles.

Reiterate:
Study my Technical Chart in detail for enlightenment: Fools are those in 2018 declaring for bear market, crisis or recessionary economy when we are in expansionary bull market of a lifetime -- with crazy upsides of once-in-a-lifetime as well.

Note:
The above represents Powerful Technicals of Straits Times Index from 1988 to 2018 (30 Years) with projection to 2028.

Tuesday 6 November 2018

The True Picture of Yangzijiang Shipbuilding: 6 November 2018, Tuesday, 2.27pm Singapore Time


The True Picture of Yangzijiang Shipbuilding: 
6 November 2018, Tuesday, 2.27pm Singapore Time
(Click on Technical Chart above to Expand)

Today, I am going to point out certain facts (Universal Truths) about Yangzijiang Shipbuilding:
1. It has made the Very Long Term Resistance Band the Very Long Term Support Band now.
2. It has reinforced the Very Long Term Blue Support Band as strong Support Band now.
3. Actions 1 and 2 are used together with green circled region's backtest for major upmoves, in this case, the 2 actions are used to confirm for break-up of black resistance trendline, brewing for Super-Cycle upmove.
4. This is in sync with Super-Cycle large upmove in worldwide markets. Another minimum of +100% profits can be expected from here for Yangzijiang longs.
5. 90% of market herd representing market fools or fools' monies are clueless, cautious, bearish, recessionary in view and warning of bear market and market crisis worldwide. This is the brilliance of global market movements so far.
6. When Shipbuilding Industry is just switching from winter into newfound spring, global markets are just at halfway mark.
Lastly,
【Don't be a fool and follow the herd shouting for bear or drawing bearish charts-- cluelessly like a headless chicken.】