Ticker 1

Ticker 2

Click "Like" to Receive First Hand Updates From The Analysis Site / Click "SHARE" to share

Showing posts with label VIX. Show all posts

Sunday, 20 December 2020

Technicals of Fear Index VIX: 20 December 2020, 12.37am Singapore Time


Technicals of Fear Index VIX:
20 December 2020, 12.37am Singapore Time
(Click on the Technical Chart Above to Expand)

Fear factor is on the rising trend, with a backtest in 2nd green circled region being completed. The backtest is similar to the one as highlighted by the 1st green circled region. Fear is frothing.

DISCLAIMER

This analysis site, as well as the analyses in it, is created for the sole purpose of education, discussion, fundamental analysis knowledge sharing, technical analysis knowledge sharing, funds flow analysis knowledge sharing, general skills-knowledge sharing and opinions sharing. The contents of this blog are not to be taken as investment advice or inducement to trade, and I take no responsibility for any gains or losses as a result of reading my analyses, judgements and opinions. In essence, practise due diligence.   

Wednesday, 20 November 2019

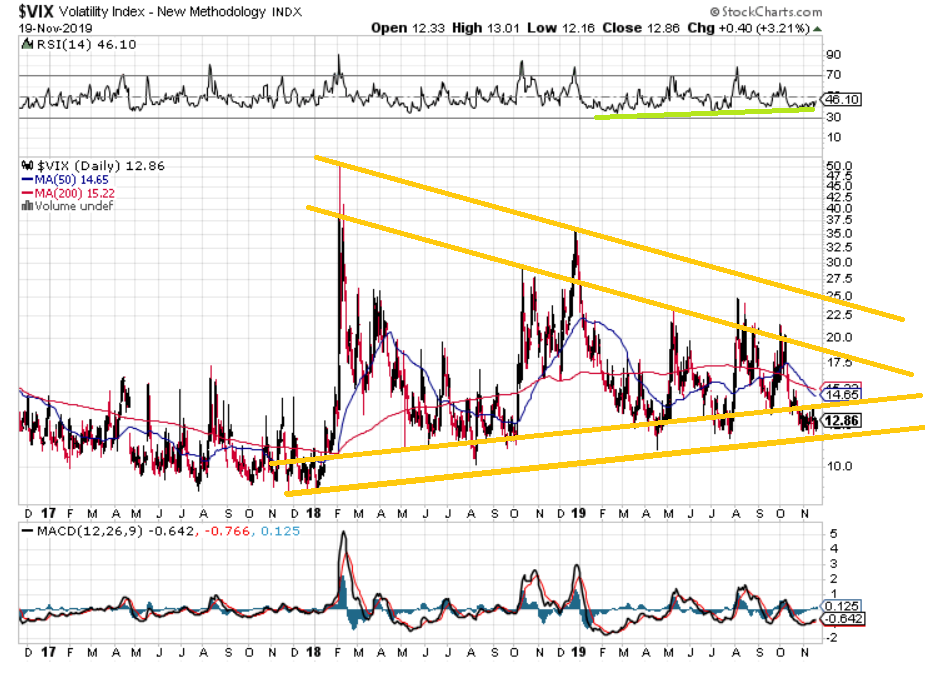
VIX Fear Index: 20 November 2019, Wednesday

VIX Fear Index: 
20 November 2019, Wednesday
(Click on Technical Chart above to Expand)

Attached is the Updated Technicals for the VIX Fear Index.
Short term fear is coming to the financial markets.


DISCLAIMER
This analysis site, as well as the analyses in it, is created for the sole purpose of education, discussion, fundamental analysis knowledge sharing, technical analysis knowledge sharing, funds flow analysis knowledge sharing, general skills-knowledge sharing and opinions sharing. The contents of this blog are not to be taken as investment advice or inducement to trade, and I take no responsibility for any gains or losses as a result of reading my analyses, judgements and opinions. In essence, practise due diligence. 

Tuesday, 6 February 2018

VIX Characteristics and Implications: 6 February 2018, Tuesday, 9.52am Singapore Time

VIX Characteristics and Implications: 
6 February 2018, Tuesday, 9.52am Singapore Time
(Click on Technical Chart above to Expand)

Attached is the technicals for the VIX Index, a measure of the fear index and is heavily influenced by puts options in the market. The 1st green circle is where markets sold off which then bore fruits in the greatest tech stocks rally worldwide, with the NASDAQ creating all time new highs. The 2nd green circle is where markets sold off sharply in a short time which then bore fruits in super rally of bank stocks worldwide, sending DJIA and S&P500 into all time highs. The 3rd green circle is where we are now, this time round it will bear fruits in commodity stocks, energy stocks, crude oil stocks, oil related O&G stocks, shipping stocks, shipbuilding stocks, and a great bull rally in Emerging Markets. Market crash of any bear market will never allow for time to brew slowly in VIX which allows for Walls of Worries and Fear to be set up. These spikes in fear are needed in bull markets to confirm bull markets, yet effective in throwing confusion smoke bombs into the herd who will sell everything on panic and fear. The markets are catching the currently high amount of margins out there, to take over their positions cheaply. Those who are shorting, on the other hand, do be sure you are not shorting strong stocks such as banks, because the punishment when this ends will be heavy.


Wednesday, 30 August 2017

Worldwide Financial Market Update : 30 August 2017, Wednesday, 11.50pm Singapore Time


Worldwide Financial Market Update : 
30 August 2017, Wednesday, 11.55pm Singapore Time

There is a trinity of suppression resistances in VIX now as illustrated on technical chart attached. Worldwide Stocks and Equities Markets have 85% probability of ending their corrections on last day of August. September 2017 onwards, stock markets may resume their big wave uptrend. Those stocks that did not correct down much during the past 3 weeks' correction will be the first to make short term bottom, first to resume rally and likely rally the most. US and Asian stock markets will be strong. Dig for stocks that did not correct down or did not correct down much the past 3 weeks and appear in top volume buying actions in September 2017. These stocks will have sustained flying action. Bank stocks anywhere in the world are a must-buy on dip. There is now a new market S.O.P as illustrated in Green Circles on the attached VIX chart: conduct short term selling raids every month in the stocks and equities markets worldwide while pushing gold markets impulsively up for new big uptrend in gold. This will maintain uptrend in Stocks and Equities Markets worldwide while creating big wave uptrend in gold.


Thursday, 17 August 2017

VIX Volatility Fear Index: 17 August 2017, Thursday, 11.37pm Singapore Time

VIX Volatility Fear Index: 
17 August 2017, Thursday, 11.37pm Singapore Time
(Click on Chart above to Enlarge)

Attached above is the updated technicals for VIX and the follow-up analysis for VIX.
Volatility Index (Fear Index) is attempting to find support at 11.93, this means worldwide stock markets' short term corrections have another 1-3 weeks more to go (mid-point: 2 weeks) and VIX volatility index/fear index will attempt another short term wave up as indicated by the blue arrow. Gold will continue to be the best investment, because gold will rally with fear, and gold will also go uptrend with worldwide stock markets' rally. Gold only has one direction up, i.e. to rally beyond $2000 an ounce. Aug-Sept VIX merely provided gold with some more rocket fuel.
The put options and put warrants in the markets, as forewarned 2 weeks ago, needed to make some quick money through short term correction and they are not done nor finished with the process yet.

Gold within one's portfolio:
Bullish/Upwards Pressure

Friday, 4 August 2017

VIX: 4 August 2017, Friday, 10.24am Singapore Time

VIX: 4 August 2017, Friday, 10.24am Singapore Time
(Click on Chart above to Enlarge)

Attached above is the technicals for VIX.
Momentum is building up for volatility index.
Short term correction is coming. 
Target to end the short term correction:
VIX = 13.40
The put options and put warrants in the markets need to make some quick money soon.

Gold within one's portfolio:
Bullish/Upwards Pressure

Tuesday, 11 April 2017

VIX Fear Index: 11 April 2017, Thursday, 4.33pm Singapore Time

VIX Fear Index: 
11 April 2017, Thursday, 4.33pm Singapore Time
(Click on Chart above to Enlarge)

International smart monies worldwide have recently accumulated quite some amount of short term bearish protective puts to protect their long term bullish longs holdings. This means while markets are still long-term bullish and mid-term bullish, the short term remains a corrective consolidation. It is also a chance for gold to make further gains to catch up with the stocks and equities asset class. In summary, this means the VIX Fear Index may climb up in April and equity markets likely still in corrective-consolidation mode for April 2017. North Korea and Syria risks may be temporary based on international funds flow. Use the fear as a comeback boat and not to view it as bear market.


Tuesday, 1 April 2014

VIX: 1 April 2014, Tuesday, 9.15pm Singapore Time

VIX: 1 April 2014, Tuesday, 9.15pm Singapore Time
Chart courtesy of StockCharts.com

Attached above is the daily chart of the VIX Fear Index. It is doing a large rounding bottom formation which is essentially bullish in formation as above; a large bullish VIX build-up implies a large bearish stocks and equities market build-up. 

The long term bullish build-up in VIX has serious implications:
Financial markets are building up big in bearishness, and this coincides with the worldwide financial markets' transition to bear markets. 

All previous VIX analyses:

Donovan Norfolk Ang Technical Rating:
Bullish on VIX
Bearish of Stocks and Equities Worldwide
(Get out of stock markets)


Click "Share" on the Facebook icon at the bottom of this thread if you like it, or 
if you would like to start a discussion about it with friends on your Facebook Wall.

Sunday, 16 February 2014

VIX (Fear Index): 16 February 2014, Sunday, 3.00am Singapore Time

VIX (Fear Index): 16 February 2014, Sunday, 3.00am Singapore Time
Chart courtesy of StockCharts.com

Attached above is the weekly chart of the VIX Fear Index. It is in bullish formation as above, and a bullish VIX build-up implies bearish stocks and equities market build-up. 

VIX (Fear Index): 16 February 2014, Sunday, 3.00am Singapore Time
Chart courtesy of StockCharts.com

The above attached chart is the daily chart of the VIX Fear Index. VIX Fear Index moving down is a bullishness in stocks and equities markets, and the vice versa is also true that VIX Fear Index moving up is a bearishness in stocks and equities markets. The VIX is currently reflecting the short-mid term rebounds in financial markets worldwide; however, the Fear Index VIX is also reaching supports soon. 

This entire structure means that worldwide stocks and equities markets will have one final escape wave, using VIX at 17.00 points to aid in the escape wave, while VIX at 11.00 to 13.00 points will continue to help build up the transition to bear market.

The Price Performance Indicator of the VIX is also building up in a large formation as shown in the chart above.

Be Cautious of the stocks and equities markets; use this short-mid term escape wave rebounds to unload long term investment portfolios.


Click "Share" on the Facebook icon at the bottom of this thread if you like it, or 
if you would like to start a discussion about it with friends on your Facebook Wall.

Sunday, 16 December 2012

VIX Index: 16 December 2012, Sunday, 12.27pm Singapore Time

Volatility Index: 16 December 2012, Sunday, 12.27pm Singapore Time

As attached, the VIX has found supports at SUPPORT-1, SUPPORT-2, SUPPORT-3 AND SUPPORT-4.  A Confirmation of stocks' bearish-volatility will be achieved on break-up of 18.5 and closing above 20.0.

Watch out for storm clouds gathering.

Home: