Ticker 1

Ticker 2

Click "Like" to Receive First Hand Updates From The Analysis Site / Click "SHARE" to share

Showing posts with label STI. Show all posts

Monday, 28 December 2020

Stock Market Plunges Worldwide Is Coming: 28 December 2020, 1.52pm Singapore Time


Stock Market Plunges Worldwide Is Coming:
28 December 2020, 1.52pm Singapore Time
(Click on the Technical Chart Above to Expand)

Sampling one of the most quality fruits from within the basket of all stock markets in the world -- the Singapore Straits Times Index (world's best stock market barometer): the escape wave has successfully backtested the resistance as shown. The next technical target will be 1500-1600 points representing a significant fall which will also be sharp based on the vacuum zone.
(Sidenote: I had actually sampled all the fruits within the basket -- stale and sour already, in case you thought I had sampled just one fruit)

DISCLAIMER

This analysis site, as well as the analyses in it, is created for the sole purpose of education, discussion, fundamental analysis knowledge sharing, technical analysis knowledge sharing, funds flow analysis knowledge sharing, general skills-knowledge sharing and opinions sharing. The contents of this blog are not to be taken as investment advice or inducement to trade, and I take no responsibility for any gains or losses as a result of reading my analyses, judgements and opinions. In essence, practise due diligence.   

Monday, 29 July 2019

Straits Times Index (STI): 29 July 2019, Monday


Straits Times Index (STI):
29 July 2019, Monday
(Click on the Technical Chart Above to Expand)

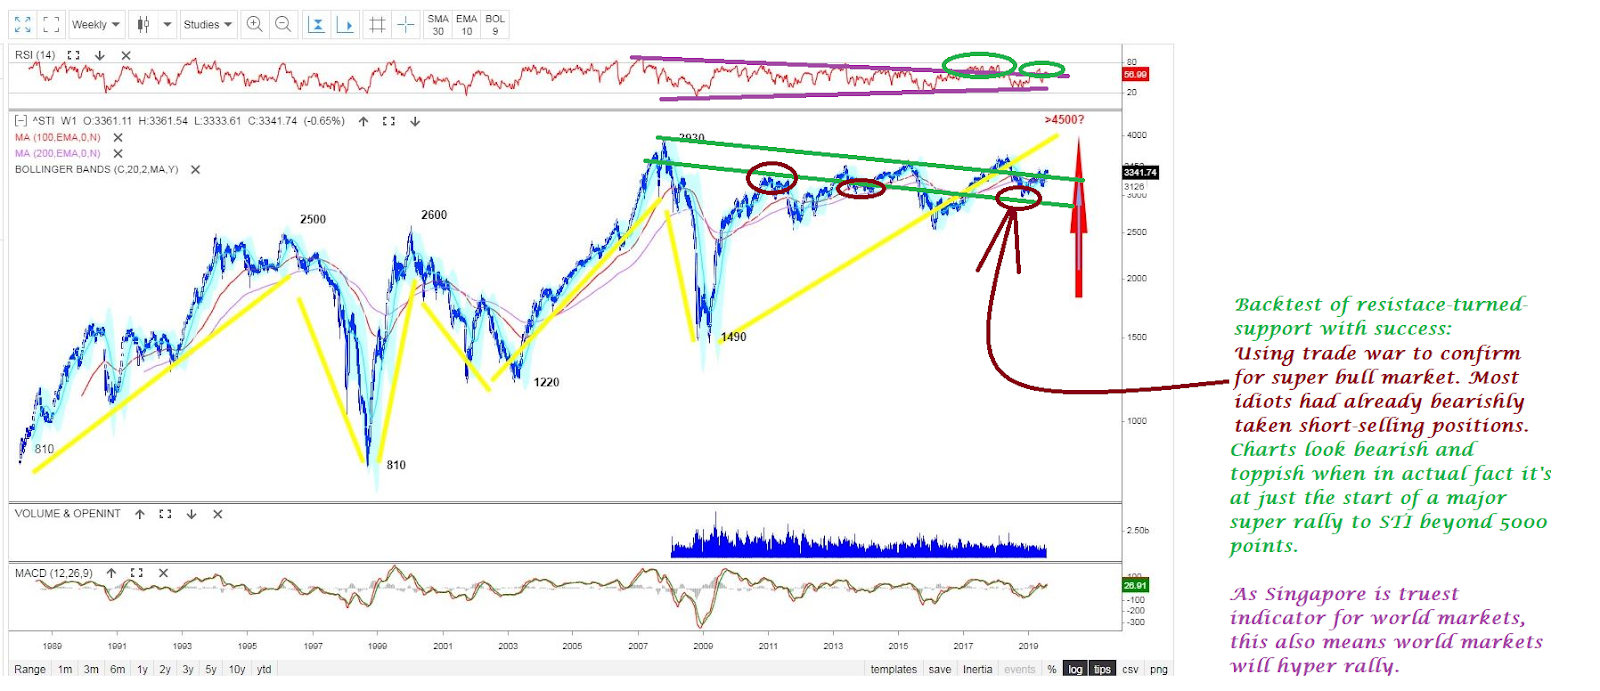
Attached is the Technicals for Singapore Straits Times Index (STI). The final brown circled region is the backtest of critical resistance-turned-support with success. The backtest confirmation of huge bull market was achieved using trade war as the fake smoke screen, i.e. to throw the 90% market herd majority into disarray and run for shelter while markets are to dump them behind. It is also an operation to lure market majority to short-sell the financial markets. Most people had already sold, left, short-sold or gone into bearish recession mode. The Straits Times Index is ready to go beyond 5000 points. As Singapore is world's barometer for financial market performances, this also means worldwide equity markets are going to hyper rally.

Donovan Norfolk Technical Rating for Worldwide Equity Markets:
Bullish

DISCLAIMER

This analysis site, as well as the analyses in it, is created for the sole purpose of education, discussion, fundamental analysis knowledge sharing, technical analysis knowledge sharing, funds flow analysis knowledge sharing, general skills-knowledge sharing and opinions sharing. The contents of this blog are not to be taken as investment advice or inducement to trade, and I take no responsibility for any gains or losses as a result of reading my analyses, judgements and opinions. In essence, practise due diligence. 

Monday, 3 June 2019

Straits Times Index (STI): 3 June 2019, Monday


Straits Times Index (STI):
3 June 2019, Monday
(Click on the Technical Chart Above to Expand)

Attached is the Technicals for Singapore Straits Times Index (STI). STI gives an important glimpse into the state of the world economy. STI has traditionally been the most reliable indicator in measuring true strength of global economy. Most international trade passes through Singapore and it is the 3rd most important financial centre in the world. The STI is currently sitting on trendline support bands in orange and red. This trend band is responsible for maintaining resumption of long term uptrend. In addition, when the STI broke down pink trend line support, it did not engage in backtesting 3073-3171 points as resistance (green horizontal lines and purple horizontal line). Instead, under the guidance of bullish fan structure, it re-captured the 3073-3171 points and backtested these as supports again. We are not in any preparation for worldwide recession as the global media has claimed or warned about. We are in unstoppable bull market worldwide. Price actions speak for itself.


DISCLAIMER

This analysis site, as well as the analyses in it, is created for the sole purpose of education, discussion, fundamental analysis knowledge sharing, technical analysis knowledge sharing, funds flow analysis knowledge sharing, general skills-knowledge sharing and opinions sharing. The contents of this blog are not to be taken as investment advice or inducement to trade, and I take no responsibility for any gains or losses as a result of reading my analyses, judgements and opinions. In essence, practise due diligence. 

Wednesday, 12 December 2018

Updated Straits Times Index Analysis (Global Rally Coming): 12 December 2018, Wednesday, 9.29am Singapore Time


Updated Straits Times Index Analysis (Global Rally Coming): 
12 December 2018, Wednesday, 9.29am Singapore Time
(Click on Technical Chart above to Expand)

Attached above is the Monthly Technicals of FTSE Singapore Straits Times Index (FTSE STI). If you had been learning from my teachings all along, you will know that Singapore FTSE STI is the number 1 indicator for global economic health and worldwide financial markets. The reasons had been explained in my previous FTSE STI teachings. STI is maintained in strong uptrend supported by the 2 black trend lines. The worst of the "trade war" (initial salvos are often the worst) is almost over, and the STI has not fallen much. Each time the black line supports are touched, a major global rally, including STI, follows. We are at that point now. There is also a  2-month higher low higher high created now -- candle formed such that majority of the herd remains bearish. We are ready for major significant widespread rally in 2019-2020.

Straits Times Index is expected to rally beyond 5000 points in the next few years. 5000 points is a minimum estimation (conservative estimation), as 6000 points is a possible target. Many worldwide blue chips, big caps, bank stocks, and index stocks are expected to make 2x gains from here -- meaning even elephants will gain twice their weight to become fat elephants.

Thursday, 8 November 2018

The True Picture of Singapore Stock Market, best reflection of Global Economic Health: 8 November 2018, Thursday, 11.22am Singapore Time


The True Picture of Singapore Stock Market, best reflection of Global Economic Health: 
8 November 2018, Thursday, 11.22am Singapore Time
(Click on Technical Chart above to Expand)

Today, I am going to point out certain facts (Universal Truths) about Singapore Stock Market:
1. The Singapore Stock Market is at the internal blue trend band support within the black super-cycle channel.
2. We have already back-tested the green classical support band twice in the past 10 years. This back-testing made up the 1st half of a SuperCycle Bull (2008-2018).
3. The next 2nd half of the SuperCycle Bull (2018-2028) will see Straits Times Index (STI) rally to 6000 points and beyond (Purple Trajectory). This means all the blue chips have +100% to +500% profit upside to go, mid caps have +500% to +1000% upside, and small caps have +1000% to +5000% upside, if we base on previous bull market cycles.

Reiterate:
Study my Technical Chart in detail for enlightenment: Fools are those in 2018 declaring for bear market, crisis or recessionary economy when we are in expansionary bull market of a lifetime -- with crazy upsides of once-in-a-lifetime as well.

Note:
The above represents Powerful Technicals of Straits Times Index from 1988 to 2018 (30 Years) with projection to 2028.

Thursday, 25 October 2018

A Re-Glimpse into Singapore Straits Times Index and the Future of the World Economy : 25 October 2018, Thursday, 10.23pm Singapore Time


A Re-Glimpse into Singapore Straits Times Index and the Future of the World Economy : 
25 October 2018, Thursday, 10.23pm Singapore Time
(Click on Technical Chart above to Expand)

While the majority of the world are bearish with conviction with many declaring bear market, attached above is A Re-Glimpse into Singapore Straits Times Index and the Future of the World Economy. Just take note of 3 key points here: (1) Super-Cycle Impulsive Wave 1; (2) Large Bullish Ascending Triangle of Consolidation; (3) Super-Cycle Impulsive Wave 2.
Notice also where we are at the current correction (nearing black trend line support again).

Wednesday, 26 September 2018

Singapore Straits Times Index: 26 September 2018, Wednesday, 1.29pm Singapore Time


Singapore Straits Times Index: 
26 September 2018, Wednesday, 1.29pm Singapore Time
(Click on Technical Chart above to Expand)

Attached is the Technicals of Singapore Straits Times Index reflecting the market conditions of Singapore and Worldwide Financial Markets -- Singapore being the most reliable indicator for economic health of the world. The Mid Term Significant Bullish Wedge of Re-accumulation in Black-lined structure has successfully been completed. This bullish wedge of shakeout has successfully shaken out many mentally weak investors and traders, and is a prelude of the next half of the Super-Cycle (S.C) humongous upmove to come. Majority of market investors and traders judged that we are in bear market, however, as reiterated, we are at merely the 50th percentile (midway) of a long term (S.C) bull market.


Sunday, 17 June 2018

Straits Times Index (STI) -- the litmus indicator for World Market Performance: 17 June 2018, Sunday, 5.55pm Singapore Time

Straits Times Index (STI) -- the litmus indicator for World Market Performance:
17 June 2018, Sunday, 5.55pm Singapore Time
(Click on Technical Chart above to Expand)

Attached is the Very Long Term Technicals for Singapore Straits Times Index. The Straits Times Index has had broken up the 10-year trend resistance (double black lines) and is currently using the short-mid term correction to backtest this 10-year Resistance-Turned-Support in black.  Once this backtest completes, Straits Times Index will go for a target of way beyond 4000 points (4500-5000 point as target). This kind of backtest will normally shake out majority of the herding market participants. This is a market S.O.P -- it likes to shake out weak holders with fear before the next very major large wave up. We are still in Secular Bull Market (refer to trajectory in blue). There is 0% chance of bear market in current economic cycle of expansion. Corrections remain healthy.


Friday, 25 May 2018

Singapore Straits Times Index: 25 May 2018, Friday, 9.01am Singapore Time

Singapore Straits Times Index:
25 May 2018, Friday, 9.01am Singapore Time
(Click on Technical Charts above to Expand)

Attached is the Technicals for Singapore Straits Times Index (STI). The STI is of the following technical price structure:

Long Term Uptrend
Mid Term Sideways
Short Term Correction

The short term correction is ending soon. Buy on healthy dips. The dips are being used to build supports for the launching of more uptrend. If you are an investor of stocks, index stocks and blue chips, you would be glad to know that the ichimoku red clouds have been weak passing clouds while the green clouds have been strong cumulonimbus green clouds. The long term trend is strong. In addition, because of the technical price structure, shorting of the market presents high risk with low reward compared to buying on dips which will give higher rewards for the lower risk. Bullish.

Wednesday, 18 April 2018

Straits Times Index Next Immediate Target is 3850 points and break-up of 4000 points:18 April 2018, Wednesday, 4.35pm Singapore Time

Straits Times Index Next Immediate Target is 3850 points and break-up of 4000 points: 
18 April 2018, Wednesday, 4.35pm Singapore Time
(Click on Technical Chart above to Expand)

Attached above is the Technicals for Straits Times Index and the Singapore Stock Market. The black coloured large BULL pennant has been completed. A large bull pennant will yield a large BULL MARKET UPMOVE. The blue circled regions and purple circled regions are successful backtest confirmations for the bull market using fear to achieve bull confirmations. Straits Times Index has broken up critical bull pennant now. The STI has next immediate target of 3850 points now. It will proceed to challenge for historical highs never ever seen before and will eventually break up 4000 points as well, something preempted in 2016. More rallies coming.


Wednesday, 29 November 2017

Singapore Straits Times Index: What to expect next?

Singapore Straits Times Index: What to expect next? 
29 November 2017, Wednesday, 12.21pm Singapore Time
(Click on Technical Chart Above to Expand)

Attached is the technicals for the Singapore Straits Times Index. The green zones are my live forewarnings in 1H-2016 and 2H-2016 to get back into the financial markets cautioning before prices move that the sell-off would be about to end (amidst widespread bearish conviction among the herd). The light green zone is the break-up per my forewarnings. The purple arrows are series of major waves that markets made right after my bullish forewarnings. The pink zones are international financial markets' show of intentions in 2H-2017 to absorb all breakdowns and carry on positive momentum.

Now comes the more important points and the look-ahead. The Singapore markets deliberately over-rallied to break up the turquoise coloured classical band of support at 3274-3360 points just before market-dampening news of increment in tax rates and increment in GST tax rates came out. This ensures that once the market-negative tax news is out now, markets will have no chance of breaking down critical supports; instead it will have the chance to use these bearish tax news to retrace and confirm long term bull market supports (yellow zone).  The movement is for re-accumulation and adding of positions using bearish news (while public would be pessimistic) and not for selling. This intention had already been confirmed by where the orange arrow is pointing. 

On macro-technical conclusion, we will start 2018 at lower points with respect to November-December 2017 price-action points. In doing so, this ensures that all supports are back-tested and long term bull markets are double confirmed at higher points by the time markets open the new year 2018 at the retraced yellow zones. Once the new year 2018 starts, a new wall of worries would had already been erected for the weak-minded traders and investors, and quite a handful of market investors would be shaken out again. This is good. This will henceforth set the launchpad for Straits Times Index beyond 4000-4500 points. US financial Sector (refer to previous analysis of the SPDR Financial Select Sector) will continue to provide north-bound fuel for worldwide stocks and equities markets. 


Reference to Previous Analysis of the SPDR Financial Select Sector:
https://donovan-ang.blogspot.sg/2017/10/spdr-financial-select-sector-starting.html


Monday, 2 October 2017

Singapore Straits Times Index: The Top Indicator of Global Economic Health

Singapore Straits Times Index: 
The Top Indicator of Global Economic Health
2 October 2017, Monday, 9.35am Singapore Time
(Click on Technical Chart above to Expand)

Attached is the technicals for Singapore Straits Times Index (STI). Historically, the Singapore STI has been the top indicator of global economic health. If the global economies are on phony growth, the STI will not climb up or if so, it will merely climb up sluggishly.  The STI has gotten out of the slug stage. Since 1H-2016 and 2H-2016, all across the board in SGX, upmoves had been with volume and downmoves had been on easily dried-up volume. This means global economies are back on track for next stage of economic prosperity for 2018, and that there will be no market crash. Parallel trajectory from lower band of yellow uptrend line is a testament further indicating committed negation of bear market and that sustained path of  newfound bull market is to be resumed again. Price actions above the pink and yellow technical lines suggest that worldwide equity markets are still full of vitality, and expect all markets, especially Asian markets, to continue upmoves for all time historic new highs.


Monday, 18 September 2017

Singapore Straits Times Index: 18 September 2017, Monday, 7.09am Singapore Time

Singapore Straits Times Index: 
18 September 2017, Monday, 7.09am Singapore Time
(Click on Technical Chart above to Expand)

Attached above is the technicals for the Singapore Straits Times Index (STI). The red circled regions are my live fore-warnings in 2015 to get out of the market, warning of a severe sell-off before it came.

The 1st green circled region is my live fore-warning in 1Q-2016 pinpointing that low to be the rock bottom of the sell off in 2016 when market sentiments were bearish. The 2nd green circled region was my reiteration to add buys back then. The 3rd green circle was where Singapore plunged into technical recession and I forewarned to buy the market amidst the technical recession, a time when 90% market majority were calling for bear market and filled with fear.

The rally into purple region came per my fore-warnings. The purple regions have successfully made 3104-3196 band as the new support band for launching super rallies. As the entire operation of price action coupled with volume flow as pointed by the yellow summary-arrow took too much efforts, with this effortful volumes chalked up by smart monies, Straits Times Index (STI) will proceed to rally to all time historic new high at 4200-4500 points. 80% of all stocks across the board to super rally. All bank stocks to super rally.


Tuesday, 4 October 2016

Straits Times Index of Singapore: Best Indicator as Litmus for Performance of Worldwide Financial Markets

Straits Times Index of Singapore: 
Best Indicator as Litmus for Performance of Worldwide Financial Markets

Attached above is the technicals for Straits Times Index (STI) of Singapore. It is the best indicator to the performance of worldwide stocks and equities markets. It is also the most honest market in the world, without much requirement for technical investors and traders to even second guess.

The Orange technical line, Black Circle and Green zone shows how the breakdown of the orange support failed to spark any significant sell-offs in 2016. Volume flow shows that Smart Monies are disinterested in any selling right now. The Straits Times Index and world financial markets are going to complete re-accumulation after the correction soon. Worldwide stock markets and STI will rally in 2017 to highs never seen before. STI will also rally to historic high of beyond 4000 points in 2017. There are too many fools calling for selling in 2016. They see no reason for rally. Hence, markets will not only rally, but super rally. Many economic indicators will show up surprisingly beyond expectations in 2017. Expectations set in 2016 for 2017 is a low bar for 2017. Even an obese bull can clear the low hurdles easily. This, in itself, will be stimulative for 2017.

DNA Technical Rating:
Bullish for 2017, 
Against herd majority expectations

Monday, 8 August 2016

Straits Times Index Technical Analysis: 8 August 2016, Monday, 8.47am Singapore Time

Straits Times Index Technical Analysis: 
8 August 2016, Monday, 8.47am Singapore Time

Attached above is the latest technicals for the Singapore Straits Times Index.
As a new fact, selling dries up easily and buying takes over impulsively since the 3rd Quarter of 2015. In the 3rd Quarter of 2016 which we are in now, the market is actually back-testing the triple supports as a showcase of intention to change gear from bearishness to bullishness. S1, S2 and S3 represent the 3 powerful supports that will be used to launch the 2H-2016 and 2017 super rally for stocks all across the board. With brainwash from the media and supposed "experts", most retailers are expecting a crash or bear market right now, so a rally will catch market majority by surprise. Correction is ending. Shorters/shortists will be betrayed big time. Bank stocks, Technology stocks, Commodity stocks and Healthcare stocks will over-perform in the market in this powerful rally.

Straits Times Index Target:
4000 points and more

Monday, 11 July 2016

Straits Times Index: 11 July 2016, Monday, 11.08am Singapore Time

Singapore Straits Times Index: 
11 July 2016, Monday, 11.08am Singapore Time

Attached above is the technicals for Singapore Straits Times Index, one of the best indicators for the health of worldwide financial markets. 

Big Hands and Smart Monies are big longs in financial markets worldwide. 
Straits Times Index is showing re-accumulation and bullish consolidation that is reaching an end of the consolidation. It is expected to break up. 

A rising tide lifts all boats, and almost all stocks are expected to rally (except problematic boats/companies that have holes). Buying of blue chips and quality mid caps present best yet safe opportunities now. It will be commodity-stocks led rally worldwide. Bull market is expected 2nd half of 2016 and in 2017 when most are expecting a stock market crash.

DNA Technical Rating of Stock markets and Financial Markets Worldwide:
Bullish 
Expected to rally for the rest of 2016 and 2017.
All markets worldwide to rally. Resumption of big bull market.


Sunday, 3 May 2015

Straits Times Index: 3 May 2015, Sunday, 11.52pm Singapore Time

Straits Times Index: 3 May 2015, Sunday, 11.52pm Singapore Time

Straits Times Index and Singapore Markets may generally experience some
selling pressure and profit taking in the coming week (except strong stocks).

Straits Times Index and Singapore markets' selling pressure will be reduced and negated if 3525 points is recaptured and made support.

However, selling pressure will increase once 3467.46 points breaks down.


Click "Share" on the Facebook icon at the bottom of this thread if you like it, or 
if you would like to start a discussion about it with friends on your Facebook Wall.

Sunday, 1 March 2015

Advanced Straits Times Index Technical Analysis: 1 March 2015, Sunday, 8.30pm Singapore Time

Straits Times Index: 1 March 2015, Sunday, 8.30pm Singapore Time
Chart courtesy of Chartnexus.com

Attached above is the Technical Analysis of the Singapore Straits Times Index.

1. There were two A-B-C Escape Waves as illustrated in chart above.

2. The 1st A-B-C Escape Wave is a Mid-Term Escape Wave highlighted in Dark Green in chart above: this escape wave has achieved price satisfaction wave completion at 3408 points.

3. The 2nd A-B-C Escape Wave is a Short-Term Escape Wave highlighted in Light Green in chart above: this escape wave has achieved price satisfaction completion at 3458 points.

4. What these two ABC Escape Waves are telling you is that in between 1st escape wave and 2nd escape wave, using a range of Straits Times Index = 50 POINTS, the stocks and equities engaged in re-distribution of stocks from the smart hands to the fools' hands.

5. On "supposed break-up" of the double RED resistance lines, market participants who use standard technical analysis bought into the stock markets, while the stock markets used a 50-pt range to unload as much stocks as possible. This explained why the markets in the period of mid-January to March of 2015 refused to rally. This is a bearish distribution immediately following a break up, something which is increasingly becoming a fake break up, fooling 90% of the market traders and investors.

6. Singapore stocks and equities are to resume long term sell off soon: Be cautious.
(Cross reference with Malaysian Markets which was just posted, and the picture becomes clear)

7. The Straits Times Index has so far refused to rally with +10.000 Donovan Norfolk Funds Flow which is bearish in nature.

8. Note also that the region above double RED resistance lines has seen very weak buying, suggesting only retailers and the public (fools' money) have been bullish, not the smart monies: BEARISH

9. Note that in the RED circle region and the RED rectangle region, the selling volume has come back: BEARISH

10. Buying volume has been corrective in nature and selling volume impulsive: BEARISH. Market has been hastening the unloading of stocks using an index-only rebound. Broad markets are weak to rebound, and this is BEARISH in nature.

Investors to continue to suffer wealth destruction in a long term bear market as warned in end-2013 and early-2014. This is still an initial phase (stage 1) of a very long term bear market.

Resumption of long term bear market selling of stocks and equities is coming. 

The following time map is the SOP rotational order of Selling:
2012 to End-2013: Transition to bear markets for very weak/thrash stocks
End-2013 to 2014: Transition to bear markets for weak stocks and below average mid-strength stocks
End-2014 to 2015: Transition to bear markets for mid-strength stocks and strong stocks, including blue chips


Important Note:

+10.000 FFA means maximum dead cat bounces as pushed by the markets have been completed. End of rebounds. This is consistent with the 2 price satisfaction point that has been achieved by Straits Times Index. This also means stocks across the board is currently more or less achieved maximum rebound from October-2014 to February-2015.

Those stocks that did not rebound within your portfolio, they are revealed by the markets now as weak stocks. Those that did not rebound much are also considered weak stocks. Markets will make new lows for these stocks in the resumption of sell-off.

Weak stocks will be hammered with strong strength (and first to be sold), mid strength stocks will be hammered with mid strength. Strong stocks (those that rebounded quite an amount with the positive Funds Flow) will be hammered the least and start selling only when FFA turns to zero or slight negative.

This is the time for all to look closely at your portfolios and see what I say happen right in your eyes again. All your portfolios will be executing the above in the coming few months.


Refer:
http://donovan-ang.blogspot.sg/2015/02/straits-times-index-22-february-2015.html
http://donovan-ang.blogspot.sg/2015/02/msci-singapore-index-simsci-13-february.html


Click "Share" on the Facebook icon at the bottom of this thread if you like it, or 
if you would like to start a discussion about it with friends on your Facebook Wall.

Sunday, 22 February 2015

Straits Times Index: 22 February 2015, Sunday, 11.10am Singapore Time

Straits Times Index: 22 February 2015, Sunday, 11.10am Singapore Time
Chart courtesy of Chartnexus.com

Bearish Ascending Wedge hidden inside Straits Times Index from September 2014 to February 2015. This is signs of further distribution (unload) in stocks from the smart monies to the foolish monies.

Stocks and equities to carry on being unloaded as warned in end-2013 and early-2014.


Click "Share" on the Facebook icon at the bottom of this thread if you like it, or 
if you would like to start a discussion about it with friends on your Facebook Wall.

Friday, 13 February 2015

MSCI Singapore Index (SiMSCI): 13 February 2015, Friday, 6.35pm Singapore Time


MSCI Singapore Index (SiMSCI): 13 February 2015, Friday, 6.35pm Singapore Time

See price structure from a mid term and long term perspective:
Smart monies have unloaded, sold and distributed large and heavy amounts of stocks and equities to the Singapore public.

Donovan Norfolk Ang Technical Rating:
Heavy Bearish Distribution with many deliberated layers of resistances piled up
(Sell/Short Singapore Stocks Market, MSCI Singapore and Straits Times Index)


Click "Share" on the Facebook icon at the bottom of this thread if you like it, or 
if you would like to start a discussion about it with friends on your Facebook Wall.