Ticker 1

Ticker 2

Click "Like" to Receive First Hand Updates From The Analysis Site / Click "SHARE" to share

Thursday, 17 May 2018

iShares MSCI Saudi Arabia Capped ETF (AMEX: KSA): 17 May 2018, Thursday, 12.05pm Singapore Time

iShares MSCI Saudi Arabia Capped ETF (AMEX: KSA): 
17 May 2018, Thursday, 12.05pm Singapore Time
(Click on Technical Chart above to Expand)

Attached above is the Technicals for iShares MSCI Saudi Arabia Capped ETF (AMEX: KSA). The S&P Dow Jones is considering to lift Saudi Arabia to Emerging Market status soon. This is a surest buy before the consideration is established as facts. The target projection is measured by X, representing a significant upside. This is a mid-term uptrend asset class that will continue into a long term uptrend. It is a low risk, high reward and high probability trade. This represents some of the most golden opportunities, in tune with the positive sentiment created by the future IPO listing of Saudi Aramco. 

The Donovan Norfolk Technical Rating:
Highly Bullish

Wednesday, 16 May 2018

Dow Jones Industrial Average: 16 May 2018, Wednesday, 12.15am Singapore Time

Dow Jones Industrial Average: 
16 May 2018, Wednesday, 12.15am Singapore Time
(Click on Technical Chart above to Expand)

Attached above is the Technicals for Dow Jones Industrial Average. It has broken up the extremely large symmetrical triangle of consolidation in black. A large break-up in price structure yields a large price move up. This means DJIA will begin to move beyond the highest high of the triangle. The next target will now be a break-up of 26705.6 points. The next long term target will be 30,000 points for the Dow Jones Industrial Avg Index. DJIA is currently attempting to do a short term backtest at the light green support zone. Once this current back-test of resistances-turned-supports conclude soon, it will brew for a breakout of 26705.6 points. Buy on dips. Markets are very bullish with high upside ahead.


Tuesday, 15 May 2018

DBS Bank Technical Update: 15 May 2018, Tuesday, 2.45pm Singapore Time

DBS Bank Technical Update: 
15 May 2018, Tuesday, 2.45pm Singapore Time
(Click on Technical Chart above to Expand)

Attached above is the Technicals for DBS Bank. DBS Bank is still doing a final back-test of support before we will never the equity price below $30.00 again. The next short term target is $33.26 based on the impulsive thrust of April 2018. This short term target move towards $33.26 is part of a long term move towards $54.32 -- the first real shot at the long term target price. The second long term target price is $100.00.

Past Analyses of DBS Bank
(the most insightful and the most in-depth you can ever get):
http://donovan-ang.blogspot.sg/search/label/DBS

Monday, 14 May 2018

Malaysia KLSE: These 5 Stocks will benefit from new government (Highly Bullish): 14 May 2018, Monday, 9.16am Singapore Time

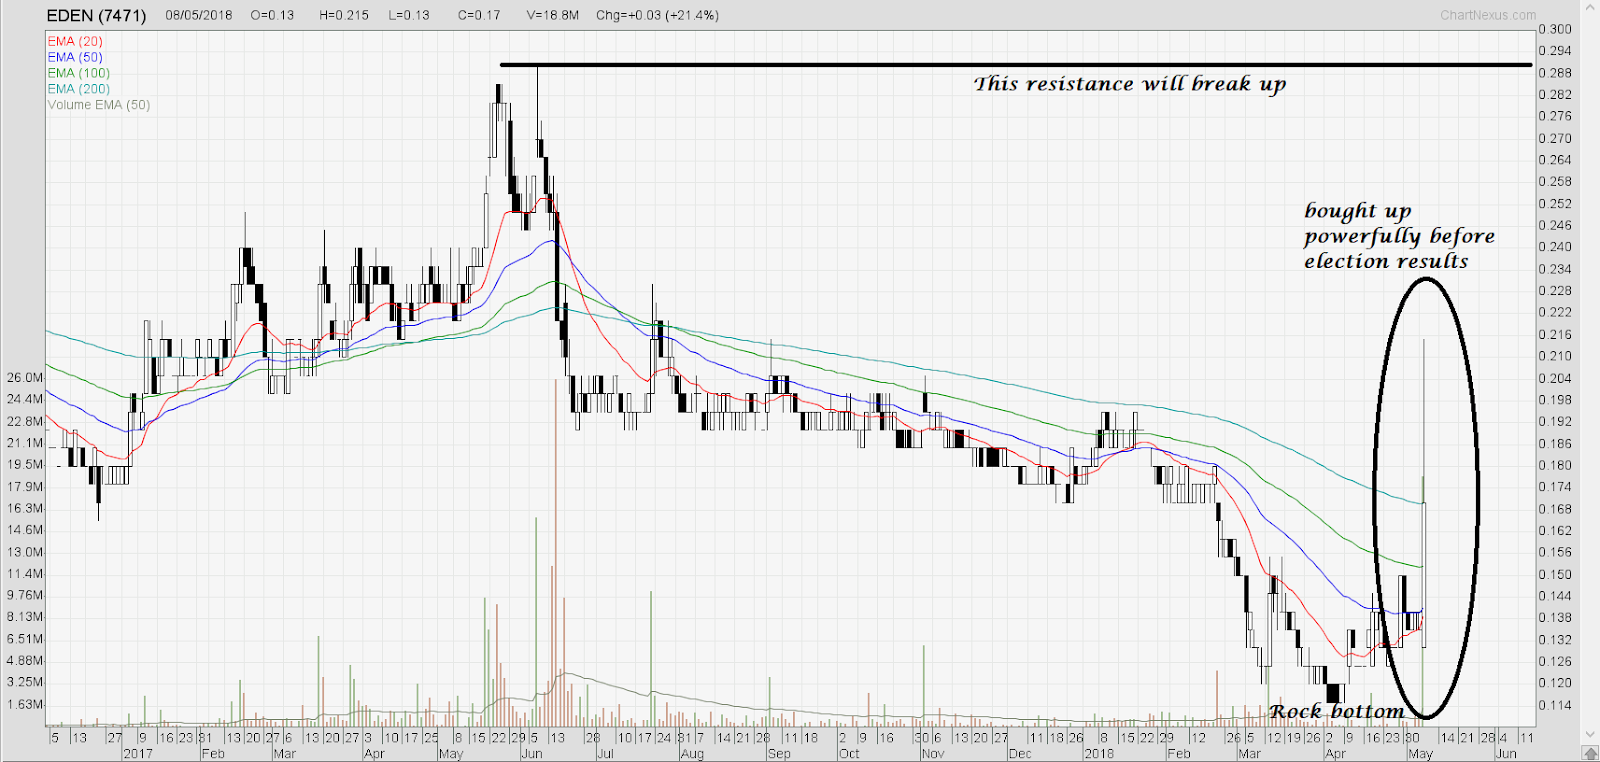
In Malaysia KLSE, these 5 companies will benefit from the new government based on opening volume flow. These will be bullish and go up for the next 1 year with high upsides.
In fact they will make rock bottom this year.

1. SAPURA ENERGY
2. EDEN INC BHD
3. OPCOM HOLDINGS 
4. BERJAYA CORP
5. SUMATEC RESOURCES

SAPURA ENERGY:
14 May 2018, Monday, 9.16am Singapore Time

EDEN INC BHD:
14 May 2018, Monday, 9.16am Singapore Time

OPCOM HOLDINGS:
14 May 2018, Monday, 9.16am Singapore Time

BERJAYA CORP:
14 May 2018, Monday, 9.16am Singapore Time

SUMATEC RESOURCES:
14 May 2018, Monday, 9.16am Singapore Time
(Note: Sumatec is a pn17 stock; do avoid sumatec if one cannot stomach the risk. High risk means high gain for such stocks, but also high loss. This stock is to be played like a warrant: placing in 1k for making 5k or 10k for instance.)

Donovan Norfolk Volume Flow Rating:
High Bullish
(Buy)
THESE 5 STOCKS WILL ROCK BOTTOM (TRUE BOTTOM) IN MAY 2018.


Thursday, 10 May 2018

Diamondback Energy (NASD: FANG): 10 May 2018, Thursday, 9.47pm Singapore Time

Diamondback Energy (NASD: FANG): 
10 May 2018, Thursday, 9.47pm Singapore Time
(Click on Technical Chart above to Expand)

Attached is the updated technicals for Diamondback Energy (NASD: FANG). 
Diamondback Energy was the DNA Top Buy list of NYSE-NASDAQ.
Diamondback Energy Overall Analysis as below:
(NASD: FANG)
The Apple of Oil industry
Fundamentals Analysis: bullish
Technical Analysis: bullish
Volume Flow Analysis: bullish

Ascending Triangle of Accumulation is executing a high volume break-up.
This stock will rocket to the sky.
Free money raining from Helicopter-Don.


DBS Bank Technical Update Two: 10 May 2018, Thursday, 10.45pm Singapore Time

DBS Bank Technical Update Two: 
10 May 2018, Thursday, 10.45pm Singapore Time
(Click on Technical Chart above to Expand)

Markets continue to have induced a lot of retailer shorts and retailer sells. 
Markets are flooded with rampant DBS shorts/sells.
A whip on shortists using an abrupt soaring will continue to be brewed nicely. This will be served as a deliciously thick frothy whipped cream. 

The technicals for DBS remain of bullish bias. Real volatility is towards the upside and not downside.
Uptrend strength is intact. More up-moves coming.

Yesterday's DBS Technical Update One as attached below:
http://donovan-ang.blogspot.sg/2018/05/dbs-bank-technical-update-9-may-2018.html

iShares MSCI Malaysia ETF (NYSE: EWM): 10 May 2018, Thursday, 2.25am Singapore Time


iShares MSCI Malaysia ETF (NYSE: EWM) Heavy Plunge: 
10 May 2018, Thursday, 2.25am Singapore Time
(Click on Technical Chart Above to Expand)

The iShares MSCI Malaysia ETF seeks to track the investment results of an index composed of Malaysian equities. It is like an MSCI Index of Malaysia. As of now, Wall Street is reacting and selling the iShares MSCI Malaysia heavily resulting in a heavy crash of 【-9.19%】. The iShares MSCI Malaysia will give an indication of how Malaysian markets will open. As of now, all the major supports are being smashed down (with high volumes) for the Malaysian market. These supports, especially the dark brown classical support, will need to be reclaimed if the Malaysia bull market is to carry on. My take is the broken supports will take time to mend and will eventually be reclaimed back.


Wednesday, 9 May 2018

Crude Oil Weekly, Daily, 4-Hourly and Hourly Chart Concurrent Technical Update: 9 May 2018, Wednesday, 11.00pm Singapore Time

Crude Oil Weekly, Daily, 4-Hourly and Hourly Chart Concurrent Technical Update: 
9 May 2018, Wednesday, 11.00pm Singapore Time
(Click on Technical Chart above to Expand)

Attached above is the Crude Oil Weekly, Daily, 4-Hourly and Hourly Chart Concurrent Live Technical Update. This is how bullish the Crude Oil is, that its technicals on all major timeframes are hyper bullish concurrently. The price actions coupled with ATR and Momentum are very bullish biased. More upmoves coming. My followers' Crude Oil Live Trade Longs (Positional Trades) are now bursting with profits. Congrats to everyone.

DBS Bank Technical Update: 9 May 2018, Wednesday, 2.48pm Singapore Time

DBS Bank Technical Update: 
9 May 2018, Wednesday, 2.48pm Singapore Time
(Click on Technical Chart above to Expand)

Markets have induced a lot of retailer sells and retailer shorts. 
Markets are now flooded with rampant DBS shorts/sells.
A whip on them with a violent soar up will be the whipped cream to be served, deliciously creamy. 

The technicals for DBS remains of strong bullish bias.
Uptrend strength is strong and remains strongly intact.

Additional Intraday Charts as below:
DBS Bank Technical Update: 
9 May 2018, Wednesday, 2.48pm Singapore Time
(Click on Technical Chart above to Expand)

【I'm Rubbing Palms to Kill Short-Sellers: Deliciously Creamy】

Tuesday, 8 May 2018

The REITS Super Sell-off and The Stocks and Cyclicals Super Rally: 8 May 2018, Tuesday, 4.11pm Singapore Time

The REITS Super Sell-off and The Stocks and Cyclicals Super Rally: 
8 May 2018, Tuesday, 4.11pm Singapore Time
(Click on Technical Chart above to Expand)

Attached above is the Technicals for the FTSE ST Real Estate Investment Trusts Index (The REITS Index).  Being extra sensitive to worldwide trends, the FTSE ST indices have traditionally been reliable indicator for worldwide market movement. The red circled region is my live warnings in end-2017 and at the start of 2018 forewarning that REITS will hit inflexion point, start to sell off and go into bear market for this asset class in concern. Everything is enacting per forewarned before prices moved. Refer to past comprehensive explanations taught to you on why REITS would be unwelcomed in rising rates environment. REITS worldwide, especially Singapore, are going to end their correction up soon, and to resume in The Great REITS super plunge. There will be a long-lasting wealth destruction to come for REITS investors in general.

The super crash in REITS (dumping risk-off assets) will also correlate with super rally in risk-on stocks comprising the cyclicals, energy, crude oil, banks, commodities and other risk-on assets such as even mid-cap stocks (embracing risk-on assets).


Olam International: 8 May 2018, Tuesday, 12.10pm Singapore Time

Olam International: 
8 May 2018, Tuesday, 12.10pm Singapore Time
(Click on Technical Chart above to Expand)

Attached above is the Technicals for Olam International, one of the major soft commodity companies in the world. Olam is being cushioned strongly by the moving average band of supports. The support band has been absorbing all market sells from anyone who wants to sell. This is very bullish in nature. The volume flow so far has been very healthy, suggesting much more upside ahead. The moving average band of supports will be used to launch further uptrends. The technical price structure is as follows:

Long Term: Bullish (Uptrend)
Mid Term: Sideway Consolidation
Short Term: Correction

Additional Note:
USD's significant corrective rebound up only caused equity prices of Olam (commodity producer) to go down very insignificantly. This is because agri-producers such as Olam are in new SuperCycle Bull -- it is easy to go up and very difficult to come down.


Creative Technology: 8 May 2018, Tuesday, 10.45am Singapore Time

Creative Technology: 
8 May 2018, Tuesday, 10.45am Singapore Time
(Click on Technical Chart above to Expand)

Attached above is the Technicals for Creative Technology, the soundblaster company that used to dominate the world but is making a comeback with breakthrough sound technologies that have been patented. If you have been following me for a long time, you will have known that I am a number 1 supporter of anything that is intellectual, high order or high tech. Creative Technology has developed new Intellectual Property (IP), and this is its new fundamentals. Markets are giving endorsement with confirmations after confirmations. The moving average band of supports will be used to launch further uptrends. The volume flow has been extremely good. I would endorse it as Excellent Rating. The projection based on current technical, assuming it does not get negated, yields $13.80 as next target, a multifold multi-bagger gain. The technical price structure for Creative is as follows:

Long Term: Bullish (Uptrend)
Mid Term: Consolidation
Short Term: Consolidation
Immediate Term: Consolidation
Overall: Bullish

Additional Note:
This kind of price structure often tests one's patience, but is a high-rewarding one. If one does not expect to pay patience, then one should not expect oneself to get paid with high rewards of life. 
This is a fundamental Zen Principle of Cause and Effect of Life.


SembCorp Marine: 8 May 2018, Tuesday, 10.19am Singapore Time

Sembcorp Marine: 
8 May 2018, Tuesday, 10.19am Singapore Time
(Click on Technical Chart above to Expand)

Attached above is the Technicals for Sembcorp Marine which together with Keppel Corp dominates their industry. Sembcorp Marine is cushioned strongly by the moving average band of support. This band of supports have been absorbing all market sells from the retailers and from anyone who wants to sell. This is very bullish in nature. The moving average band of supports will be used to launch further uptrends. The technical price structure is as follows:

Long Term: Bullish (Uptrend)
Mid Term: Correction
Short Term: Sideway
Immediate Term: Correction
(Bad news is never able to cause this stock to go below moving average band that is acting as a strong band of support for its general uptrend: Bullish. More uptrend expected)


Keppel Corp: 8 May 2018, Tuesday, 10.00am Singapore Time

Keppel Corp: 
8 May 2018, Tuesday, 10.00am Singapore Time
(Click on Technical Chart above to Expand)

Attached above is the Technicals for Keppel Corp, the largest oil rig builder in the world. It has entered into the $8.00 Support Zone and making this $8.00 the support. The move is for buying to join as a comeback boat for the uptrend. Keppel Corp remains bullish. The technical price structure is as follows: 
Long Term: Bullish (Uptrend)
Mid Term: Bullish U-shaped Consolidation
Short Term: Bullish (Uptrend)
Immediate Term: Consolidation (comeback boat for joining the uptrend)
Overall: Bullish

Additional Note: Volumes are very healthy as illustrated on technical chart.

OCBC Bank: 8 May 2018, Tuesday, 9.47am Singapore Time

OCBC Bank: 
8 May 2018, Tuesday, 9.47am Singapore Time
(Click on Technical Chart above to Expand)

Attached above is the Technicals for OCBC Bank. It has entered into the Yellow Zone of Support for buying to join as a comeback boat for the uptrend. OCBC remains bullish. The technical price structure is as follows: 
Long Term: Bullish (Uptrend)
Mid Term: Bullish (Uptrend)
Short Term: Bullish (Uptrend)
Immediate Term: Correction (comeback boat for joining the uptrend)
Overall: Bullish


DBS Bank: 8 May 2018, Tuesday, 9.36am Singapore Time

DBS Bank: 
8 May 2018, Tuesday, 9.36am Singapore Time
(Click on Technical Chart above to Expand)

Attached above is the Technicals for DBS Bank. It has entered into the green buy on dip zone. DBS Bank remains bullish. The technical price structure is as follows: 
Long Term: Bullish (Uptrend)
Mid Term: Bullish (Uptrend)
Short Term: Bullish (Uptrend)
Immediate Term: Correction (comeback boat for joining the uptrend)
Overall: Bullish


Monday, 7 May 2018

Cross Sector Zeroing for Portfolio Adjustment: 7 May 2018, Monday, 7.00pm Singapore Time

Cross Sector Zeroing for Portfolio Adjustment: 
7 May 2018, Monday, 7.00pm Singapore Time
(Click on Technical Charts above to Expand)

As we approach the middle of the year of 2018, it is time to have a look across sectors. S&P500 is used as litmus for economic cycle here. Most equity markets worldwide follow similar economic pattern. This is because the global international trade and finance are interweaved reasonably tight now.

Attached above is the Cross Sector Zeroing Technique for Portfolio Adjustment. Each of the sectors is used to contrast against the benchmark S&P 500 Index / S&P500 ETF. Two factors are used to determine strength of sector using the shortest long term timeframe period, namely price action with respect to 20MA-cum-50MA, as well as 20 MA with respect to 50MA, and price relative to peak and bottom of the past 1 year time frame under consideration.

The green boxed sectors are out-performing sectors, blue boxed sectors are on-par sectors with respect to S&P500 basket, amber boxed sectors are slightly under-performed sectors and the red boxed sectors are sectors to generally avoid in current economic cycle and sub-cycle. Based on all the above, worldwide financial markets are in risk-on mode -- smart monies are dumping consumer staples, and the cyclicals and the energy (crude oil) sectors are outperforming. This further double confirms the risk-on mode in world financial markets and double confirms that the world will continue to see strong growth in the next 4 quarters. We are still in bull market for next 4 Quarters.

The trend is likely to continue in the next one year, from mid-2018 to mid-2019. At the approximate half year mark of 2018 which is where we are now, it may be good to adjust portfolio to shift some holdings from on-par sectors to out-performing sectors, and be underweight on very under-performing sectors. The same technique can be done on any market in any part of the world.

Take for instance, as an application, if one reduces holdings from banking and finance sector, and adjust slightly towards cyclicals, energy and crude oil sector/stocks, it is not wrong to adjust in this way for more optimal performance.

Take for instance below, Tiffany & Co (NYSE: TIF), a jewellery company. It is expected to outperform compared to bank stocks or other on-par sector stocks in the coming 1 year. ( Note: $110.00 will break violently upwards easily).

Cross Sector Zeroing for Portfolio Adjustment: 
:: Tiffany & Co (NYSE: TIF) ::
7 May 2018, Monday, 7.00pm Singapore Time
(Click on Technical Chart above to Expand)

Take for instance below, Diamondback Energy (NASD: FANG), an energy/crude oil related company. It is expected to outperform compared to bank stocks or other on-par sector stocks in the coming 1 year. (Note: $132.50 will break violently upwards easily). In fact, there are already 2 very large ascending triangles of re-accumulation going on.

Cross Sector Zeroing for Portfolio Adjustment: 
:: Diamondback Energy Inc (NASD: FANG) ::
7 May 2018, Monday, 7.00pm Singapore Time
(Click on Technical Chart above to Expand)

In almost all markets, cyclicals (including luxuries, commodities, shipping and shipbuilding) and energy/crude oil sectors will be most outperforming in the next 12 months.
Best of Luck.


Friday, 4 May 2018

Funds Flow Analysis of AusNet Services: 4 May 2018, Friday, 4.50pm Singapore Time


Funds Flow Analysis of AusNet Services: 
4 May 2018, Friday, 4.50pm Singapore Time
(Click on FFA Chart Above to Expand)

Attached above is the Long Term Funds Flow Analysis of AusNet Services, an Australian energy company that is dual listed both in the Singapore SGX and the Australia ASX. AusNet Services is currently owned 31.1% by Singapore Power, 19.9% by State Grid Corporation of China and the other 49% publicly owned. Singapore Power is wholly owned by Singapore investment fund Temasek which in turn is wholly owned by the Singapore government. State Grid is the state-owned electric utility monopoly of China and the largest utility company in the world. This shows the quality of AusNet such that it has powerful backers. With such a funds flow posture currently set up, I foresee AusNet breaking up long term resistance of $2.00 with relative ease. 

Funds Flow Analysis of Ezion: 4 May 2018, Friday, 4.12pm Singapore Time

Funds Flow Analysis of Ezion: 
4 May 2018, Friday, 4.12pm Singapore Time
(Click on FFA Chart Above to Expand)

Attached above is the Funds Flow Analysis of Ezion that is traded in the market since un-suspension.
After un-suspension, the selling has seen no light to the end of the tunnel and remains a Sellers' Market with funds flow outflow in general. With this kind of posture, a violent breakdown below the psychological support of 0.100 becomes a reasonably high probability.


Funds Flow Analysis of Hi-P: 4 May 2018, Friday, 3.57pm Singapore Time

Funds Flow Analysis of Hi-P: 
4 May 2018, Friday, 3.57pm Singapore Time
(Click on FFA Chart Above to Expand)

Attached above is the Funds Flow of Hi-P that is listed in the Singapore SGX.
The 2 Red Boxes and 2 Brown Circled Regions are where markets rose, but remained as a Net Sellers' Market. These regions aligned with my fore-warnings in January 2018 to get out of tech stocks and to rotate from tech stocks into energy and crude oil stocks. The markets are executing per my January 2018 fore-warnings that monies will rotate out of technology sector and into Energy and Crude Oil Sectors. Tech stocks in the area of hardware, chips and semi-conductor had been bleeding severely, while Crude Oil prices had rallied internationally. From the looks on the tech sector outflow, it can be quite reasonable to conclude that the Trade War between China and US in the technology, telecommunications and high tech front is for real. This is the true G spot -- chips, hardware makers and semi-conductor companies will continue to feel the hit and heat.


Venture Corp Smart Money Flow: 4 May 2018, Friday, 10.55am Singapore Time

Venture Corp Smart Money Flow: 
4 May 2018, Friday, 10.55am Singapore Time

Attached is the Smart Money Flow of Venture Corp. 
This stock continues to be bearish, as per all chip-makers and most technology hardware markers
(exclude Creative Technology which has new fundamentals and new patents).
Be cautious and good luck.


Tuesday, 1 May 2018

Crude Oil Technical Analysis: 1 May 2018, Tuesday, 7.24pm Singapore Time

Crude Oil Technical Analysis: 
1 May 2018, Tuesday, 7.24pm Singapore Time
(Click on Technical Chart above to Expand)

Attached above is the Technicals for Crude Oil. What you will learn here is that The Chande Trend Meter (CTM) and the Ease of Movement (EMV) can often be used together to observe for high probability trends and how easy the trends can be achieved. In this case, notice how in December 2017 to April 2018, I had already fore-warned (before prices moved) that Crude Oil will easily move up without much obstruction in its uptrend. It had indeed moved up from $55 to $68 easily, a gain of 1300 pips (pts) in the crude oil market. EMV was mostly positive while CTM was mostly in Green Zone. In doing so, now Crude oil has broken up a Mid-Term Ascending Triangle with a successful backt-test in Green. The width of triangle is $8.00. This will yield a target price of $74.00. As the triangle is a mid-term structure, this means Crude Oil will move to $74.00 in the mid term (next 3 to 4 months). All Crude Oil stocks worldwide will move significantly up in the mid term (next 3 months). 

Lastly, as a further induction from this move, a move into the $70.00 zone will move Crude Oil beyond the $100.00 mark more than 80% of the time in the long term based on past precedents. 

Additional Note:
Besides almost all Crude Oil stocks worldwide, taking US markets as an example, these Energy ETFs will also move significantly up in the next 3 months (mid-term): 

Direxion Daily Energy Bull 3X Shares (NYSE: ERX),  
Vanguard's Energy ETF (NYSE: VDE), 
Energy Select Sector SPDR (NYSE: XLE),
 iShares U.S. Oil & Gas Exploration & Production ETF (NYSE: IEO), 
Market Vectors Oil Services ETF (NYSE: OIH), 
PowerShares DWA Energy Momentum Portfolio ETF (NYSE: PXI) 

All Crude Oil, Crude Oil Currencies and Crude Oil Related Stocks:
Highly Bullish

Mid Term TP: $74.00
Long Term TP: Beyond $100.00
Secular SuperCycle Term TP: $175-$180 
(refer to previous Crude Oil and USD SuperCycle Analysis)

Past Crude Oil Analyses: