8 May 2018, Tuesday, 12.10pm Singapore Time
(Click on Technical Chart above to Expand)
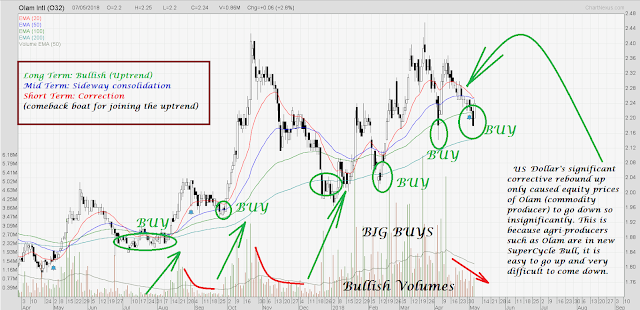
Attached above is the Technicals for Olam International, one of the major soft commodity companies in the world. Olam is being cushioned strongly by the moving average band of supports. The support band has been absorbing all market sells from anyone who wants to sell. This is very bullish in nature. The volume flow so far has been very healthy, suggesting much more upside ahead. The moving average band of supports will be used to launch further uptrends. The technical price structure is as follows:
Long Term: Bullish (Uptrend)
Long Term: Bullish (Uptrend)
Mid Term: Sideway Consolidation
Short Term: Correction
Additional Note:
USD's significant corrective rebound up only caused equity prices of Olam (commodity producer) to go down very insignificantly. This is because agri-producers such as Olam are in new SuperCycle Bull -- it is easy to go up and very difficult to come down.
Short Term: Correction
Additional Note:
USD's significant corrective rebound up only caused equity prices of Olam (commodity producer) to go down very insignificantly. This is because agri-producers such as Olam are in new SuperCycle Bull -- it is easy to go up and very difficult to come down.


No comments:
Post a Comment