Ticker 1

Ticker 2

Click "Like" to Receive First Hand Updates From The Analysis Site / Click "SHARE" to share

Thursday, 16 June 2016

NZDCAD Technical Analysis for your learning: 16 June 2016, Thursday, 11.56am Singapore Time

NZDCAD Technical Analysis for your learning: 
16 June 2016, Thursday, 11.56am Singapore Time

Attached above is the NZDCAD Technical Analysis for your learning.
Refer to previous live analyses below when the trade was taken:
I am exiting and taking profits of all my NZDCAD shorts investment now.
(i.e. cashing out the investment in the CAD buys made against NZD made in January).

From the wisdom chest of Donovan Norfolk:
Fixed mindset people only think about longs in stocks as investments. 
Growth mindset people think that anything in this world can be an investment including longs and shorts in ANY asset class.

Above are the profits in (CD) Canadian Dollar (CAD).
Below are the profits converted into (SD) Singapore Dollar (SGD).


Profits in this shorts investment trade:
+ S$ 30,011 SGD

Cumulative:
S$ 1,329,830 + S$ 30,011
= + S$ 1,359,841 SGD

Trading Journal:


Tuesday, 14 June 2016

Ascott Reit Technical Analysis: 14 June 2016, Tuesday, 10.08am Singapore Time


Ascott Reit Technical Analysis (Long Term Technicals): 
14 June 2016, Tuesday, 10.08am Singapore Time

Attached above is the long term price structure of Ascott Reit: 
The beauty is that the 3rd contact cluster of points are made after a treacherous backtest in the entire orange region. Smart Monies are really algorithmic and technical.
BEARISH

Ascott Reit Technical Analysis (Mid Term and Short Term Technicals): 
14 June 2016, Tuesday, 10.08am Singapore Time

Ascott Reit, a quality reit, has triple layers of high selling pressure resistance in the mid term and short term time frame too. If the leader of Reits pack is bearish, all other reits will be bearish and perform worse than the already bad.
Be cautious of all Reits. 

Donovan Technical Rating on all Reits:
Bearish Bias


Friday, 10 June 2016

Silver Technical Analysis: 10 June 2016, Friday, 3.15pm Singapore Time

Silver Technical Analysis: 
10 June 2016, Friday, 3.15pm Singapore Time

Attached above is the technical analysis for Silver.
Silver is completing a major bottoming out and ready for significant movement up, together with big move up in Gold.

Invest in Gold and Silver, or Gold and Silver ETFs, and not unit trusts, stocks-equities, reits or bonds.

Donovan Norfolk Technical Rating on Silver:
BULLISH


Thursday, 9 June 2016

NASDAQ-100 Technical Analysis for your learning: 9 June 2016, Thursday, 11.59pm Singapore Time

NASDAQ-100 Technical Analysis for your learning: 
9 June 2016, Thursday, 11.59pm Singapore Time

Attached above is the NASDAQ-100 Index Technical Analysis.
Refer to previous NASDAQ Index Analysis in January and February 2016 when I said buy on fear, and the reasons in Jan and Feb:

I am taking profits of the 4th batch out of 4 batches of NASDAQ longs holdings today. Full technicals as illustrated on chart. Buying on fear and selling on greed together with worldwide smart monies (funds flow analysis of hot monies) has, in general, never failed to earn me lucratively.

Another thing, for the past many weeks, because of the strategy of protective trailing stop adjusted upwards as the bull rebound goes, all my positions invested into NASDAQ-100 became free of charge, meaning maximum loss/risk of my investment is zero loss, and maximum gain is as high as the bull can go. Zero risk, zero loss, unlimited gains. But I am taking all profits off the table now (risk management). 

Above are the profits in ($) US Dollar (USD).
Below are the profits converted into (SD) Singapore Dollar (SGD).


Profits in this 4-month disciplined positional trading/investment trade:
+ S$ 197,680 SGD

Cumulative:
S$ 1,132,150 + S$ 197,680
= + S$ 1,329,830 SGD

Trading Journal:


Friday, 3 June 2016

Gold Technical Analysis: 3 June 2016, Friday, 10.52pm Singapore Time

Gold Technical Analysis: 
3 June 2016, Friday, 10.52pm Singapore Time

Attached above is the full technicals of Gold (Current Gold Price = $1241.40).

Refer to all the circled regions where I forewarned over the last 2 years that Stocks-Equities investors will suffer wealth destruction to their portfolio while those who transfer their stocks holdings to Gold will mostly preserve their wealth and can expect even more gains to come while most people would have already been damaged with bad losses.

Additional Note:
<< THE MARKET HFT ALGORITHM: Buy Gold on Dips >>
If Brexit is unsuccessful, European currencies and risk-biased currencies in demand and USD sells off, Gold rallies.
If Brexit is successful, fear floods the market and Gold rallies.


Donovan Norfolk Technical Rating on Gold and Gold ETFs (GLD):
Bullish mid-term
Bullish mid-long term
Bullish long-term
Suitable for investment

Past Gold Analyses:
http://donovan-ang.blogspot.sg/search/label/Gold

Thursday, 2 June 2016

AUDJPY Technical Analysis For Your Learning: 2 June 2016, Thursday, 11.10am Singapore Time

AUDJPY Technical Analysis For Your Learning: 
2 June 2016, Thursday, 11.10am Singapore Time

Attached above is the latest AUDJPY Technical Analysis.
Refer to the recent past live analysis which I made 2 days ago and entered the trade:

After giving the yellow flag and amber flag benefit of doubt, the red flag appeared today.
I have made the decision to cut all losses in this trade right now for risk management purposes.

Main consideration:
Technicals which led me to make the judgement of cutting as early as possible is on chart as above: yellow flag, amber flag and red flag. This is to limit the damage to as minimal as possible although the damage from a wrong short-term trade judgement had been committed.

Above are the losses in (¥) Japanese Yen (JPY).
Below are the losses converted into (SD) Singapore Dollar (SGD).


Losses in this trade:
- S$ 22,765 SGD
(A loss of -$22,765 in mere 2 days due to error in technical judgement is considered a bad trade)

Cumulative:
S$ 1,154,915 - S$ 22,765
= + S$ 1,132,150 SGD

Trading Journal:


Wednesday, 1 June 2016

CADCHF Technical Analysis: 1 June 2016, Wednesday, 9.27pm Singapore Time

CADCHF Technical Analysis: 
1 June 2016, Wednesday, 9.27pm Singapore Time

Attached above is the technicals for CADCHF short term, mid term and mid-long term trade.
I am buying CADCHF on dip. 
Multiple break-up supports as illustrated on chart.

Donovan Norfolk Technical Rating on CADCHF:
Bullish


Tuesday, 31 May 2016

AUDJPY Technical Analysis: 31 May 2016, Tuesday, 12.36pm Singapore Time

AUDJPY Technical Analysis: 
31 May 2016, Tuesday, 12.36pm Singapore Time

AUDJPY Long with Stop-loss and Target Profit as above.
Short term counter-trend trade using counter-trend momentum.
Main trend: down with counter-trend: up
(Fast Money)


Monday, 30 May 2016

Spain IBEX Index: 30 May 2016, Monday, 6.35pm Singapore Time

Spain IBEX Index: 
30 May 2016, Monday, 6.35pm Singapore Time

Attached above is the financial market of Spain.
Shorted Spain in significant amount.
One of the weakest markets.
Bearish mid-long term


Hong Kong Hang Seng Index: 30 May 2016, Monday, 3.17pm Singapore Time

Hong Kong Hang Seng Index: 
30 May 2016, Monday, 3.17pm Singapore Time

Added slight shorts on Hong Kong Hang Seng Index.


Wednesday, 25 May 2016

Hyflux: 25 May 2016, Wednesday, 2.13pm Singapore Time

Hyflux: 25 May 2016, Wednesday, 2.13pm Singapore Time

Attached above is the Technicals for Hyflux
that is listed in the Singapore SGX.

Refer in technicals above to where the distributions were conducted, which part of the secular market cycle the stock is in, where red trend band was broken, where the black classical band was broken down as well and to backtest critically (Brown Circle) to give confirmation of a stock in cancer.

Donovan Norfolk Ang (DNA) Technical Rating:
<< Bearish: Sell >>

Past Proven Track Record on Analysis of Hyflux:
http://donovan-ang.blogspot.sg/2015/03/hyflux-17-march-2015-tuesday-1230am.html
http://donovan-ang.blogspot.sg/search/label/Hyflux

Side Note:
 1st Additional Side Note: Hyflux issuing $300mil perpetual at 6% which will be increased to $500mil if it is oversubscribed makes Hyflux a clear short. Why did it not borrow cheaply from banks since current interest rate is much lower than that. Secondly, if interest rates rise, it would have to raise money at 8%-10% to attract the same batch of fools.

2nd Additional Side Note: The company is desperate to get money at any bad costs (6%). That is an initial sign of desperation, of how desperate the fundamentals may be.

NB:
DNA has no interest in this stock.


Tuesday, 24 May 2016

Global Logistic Properties Ltd (GLP): 24 May 2016, Tuesday, 7.50pm Singapore Time

Global Logistic Properties Ltd (GLP): 24 May 2016, Tuesday, 7.50pm Singapore Time

Attached above is the Technicals for Global Logistic Properties Ltd (GLP)
that is listed in the Singapore SGX.

Donovan Norfolk Ang (DNA) Technical Rating:
<< Strong Sell >>

NB:
DNA is not trading in the stock.

Past Track Record on Global Logistic Properties Ltd Technical Analysis:


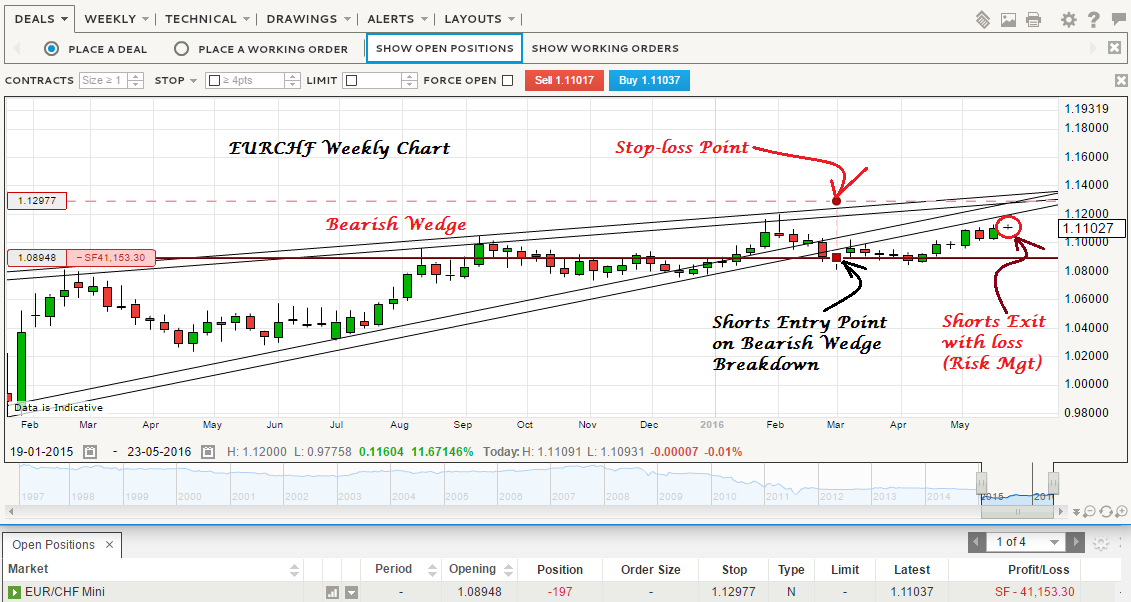
EURCHF Technical Analysis For Your Learning: 24 May 2016, Tuesday, 2.30am Singapore Time


EURCHF Technical Analysis For Your Learning: 
24 May 2016, Tuesday, 2.30am Singapore Time

Attached above is the EURCHF Technical Analysis.
Refer to the recent past live analyses in February and March 2016 when I said I would be shorting the EURCHF on the bearish wedge breakdown which I deemed to be a reliable breakdown and for which I deemed to be a good reward-risk ratio:

I have made the decision to cut all losses in this trade tonight (Singapore Time) for risk management purposes.

Main consideration:
Swiss Franc is weak beyond my expectation. Seems like SNB's negative interest rate and Switzerland's preposterous idea of even giving out free money of US$2,500 per month (S$3,485 a month) to every Swiss national for doing nothing (unconditional minimum income) is having some effects. This is as good as flushing boatloads of Swiss Francs down to the main street.
(Reference: http://www.bloomberg.com/news/articles/2016-05-23/one-of-the-world-s-most-expensive-countries-is-debating-giving-away-money)

Full technicals as illustrated on chart.

Above are the losses in (SF) Swiss Francs (CHF).
Below are the losses converted into (SD) Singapore Dollar (SGD).


Losses in this trade:
- S$ 57,586 SGD

Cumulative:
S$ 1,212,501 - S$ 57,586
= + S$ 1,154,915 SGD

Trading Journal:


Wednesday, 11 May 2016

Business, Trading & Investment Quotes of Wisdom (6)


Donovan Norfolk Ang

Click "Share" on the Facebook icon at the bottom of this thread if you like it, or 
if you would like to start a discussion about it with friends on your Facebook Wall.

France CAC40 Index: 11 May 2016, Wednesday, 2.11pm Singapore Time

France CAC40 Index:
11 May 2016, Wednesday, 2.11pm Singapore Time

Attached above is the technicals of French CAC40 index giving a glimpse of the stock markets in the European region. When Europe is resuming weakness, Asia including Singapore will also go into weakness.
Refer to the above technical illustrations.
Short at current value.


Tuesday, 10 May 2016

Germany DAX Market Technical Analysis For Your Learning: 10 May 2016, Tuesday, 4.43pm Singapore Time

Germany DAX Market Technical Analysis For Your Learning: 
10 May 2016, Tuesday, 4.43pm Singapore Time

Attached above is the German DAX Market Technical Analysis.
Refer to the recent past live analyses when I said I was longing the markets on fear in January and February and that Germany is a good investment:

I am taking profits of all the longs today and take money off this ATM Machine. I am taking some initial shorts too, flipping from longs into shorts. The main reason is that this market, similar to many other worldwide markets, has shown some weakness. Full technicals as illustrated on chart.

Above are the profits in (E) Euro (EUR).
Below are the profits converted into (SD) Singapore Dollar (SGD).


Profits in this trade:
+ S$ 111,347 SGD

Cumulative:
S$ 1,101,154 + S$ 111,347
= + S$ 1,212,501 SGD

Trading Journal:


MSCI Singapore Index: 10 May 2016, Tuesday, 8.30am Singapore Time

MSCI Singapore Index (SiMSCI):
10 May 2016, Tuesday, 8.30am Singapore Time

Attached above is the technicals of MSCI Singapore (SiMSCI) index giving a glimpse of the stock markets in the Asia-Pacific.
Short MSCI Singapore which is a strong peg to Straits Times Index at current value.
Be cautious, possibly reducing exposure, of your portfolio if you are holding stocks.
The expected 12.38 points down in MSCI Singapore is approximately equivalent to 99.04 points down for Straits Times Index.

Monday, 9 May 2016

Hong Kong Hang Seng Index: 9 May 2016, Monday, 10.00am Singapore Time

Hong Kong Hang Seng Index:
9 May 2016, Monday, 10.00am Singapore Time

Attached above is the technicals of Hong Kong Hang Seng index giving a glimpse of the stock markets in the Asia-Pacific.
Short Hang Seng Index at current value.
Worldwide Sell-Off in stocks is coming.
Be cautious, possibly reducing exposure, of your portfolio if you are holding stocks.


Euro STOXX 50: 9 May 2016, Monday, 9.51am Singapore Time

Euro STOXX 50:
9 May 2016, Monday, 9.51am Singapore Time

Attached above is the technicals of European STOXX 50 index reflecting stock markets across Europe.
Short Euro STOXX 50 Index at current value.
Worldwide Sell-Off in stocks is coming.
Be cautious, possibly reducing exposure, of your portfolio if you are holding stocks.


Thursday, 5 May 2016

Spain IBEX Market Technical Analysis For Your Learning: 5 May 2016, Thursday, 10.10am Singapore Time

Spain IBEX Market Technical Analysis For Your Learning: 
5 May 2016, Thursday, 10.10am Singapore Time

Attached above is the Spain IBEX Market Technical Analysis.
Refer to previous Spain IBEX Market Technical Analysis of 3 days ago when I was shorting:

I am taking profits of all the immediate term shorts today and take money off this ATM Machine. I have decided to laugh my way to the bank today with the profits. The main reason is that this weak market has surpassed my expectation by falling too fast in the intra-days. Full technicals as illustrated on chart.

Above are the profits in (E) Euro (EUR).
Below are the profits converted into (SD) Singapore Dollar (SGD).


Profits in this trade:
+ S$ 86,255 SGD

Cumulative:
S$ 1,014,899 + S$ 86,255
= + S$ 1,101,154 SGD

Trading Journal:


Tuesday, 3 May 2016

Gold: 3 May 2016, Tuesday, 4.40pm Singapore Time

Gold: 3 May 2016, Tuesday, 4.40pm Singapore Time

Attached above is the weekly chart of Gold with all my live fore-warnings being executed. 
 Refer to all the circled regions, price range of market actions, and the technicals of how the market is executing my fore-warnings.

I am adding some more gold investments today with Gold investments making the largest proportions of my portfolio as of now.