Ticker 1

Ticker 2

Click "Like" to Receive First Hand Updates From The Analysis Site / Click "SHARE" to share

Friday, 8 November 2013

Funds Flow Analysis (FFA): 8 November 2013, Friday, 5.59pm Singapore Time


Current Latest Computed Funds Flow Analysis (FFA):
For Worldwide Financial Markets:
8 November 2013, Friday, 5.59pm Singapore Time
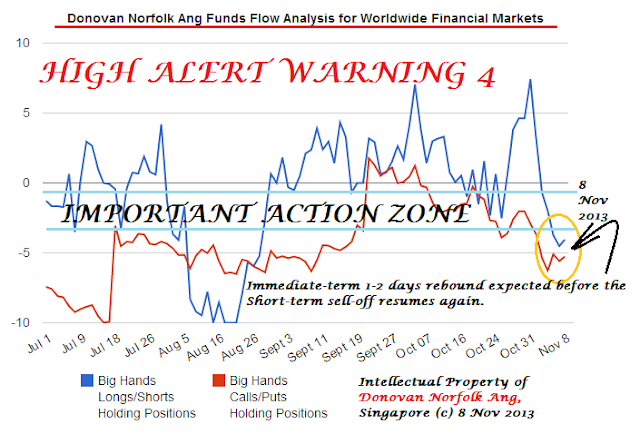
The Donovan Norfolk Ang Funds Flow Analysis Indicator 
for Worldwide Financial Markets 
8 November 2013, Friday


Broad Markets / Big Markets / Big Wind Directions

European markets are in the first 2 hours of trading, while US markets (Dow, S&P500 and NASDAQ) are 4 hours 31 minutes away from the opening bell. 

Based on current latest computational results, Holdings Index Strength of Big Hands changed from -4.512 to -4.048 in strength on the Donovan Norfolk Funds Flow Index OscillatorOn the other front, Big Hands' Puts holdings on hand changed from -5.592 to -5.264 in strength on the Donovan Norfolk Funds Flow Index Oscillator. 

Broad/Big Market (Big Wind Direction) Short-Term / Mid-Term Posture by Big Hands:

+ The continued sell-down came per expected 2 days ago as well as yesterday despite any good news such as ECB cutting of rates.
+ Big Hands took slight profits of their shorts today.
+ Big Hands took slight profits of their PUTS today (their puts are largely in the money with profits). 
+ Big Hands break away today from their 5th consecutive trading day of sells (since last Friday) while still holding bloated amount of PUTS (something still brewing short term and for which one has to be cautious of).
+ Big Hands' Short-Term Holdings are still shorts with some strength.
+ Big Hands' PUTS Holdings are still shorts with some strength too.
+ Majority of Big Hands' Shorts and Bearish PUTS are still held in place.
+ Since there are some slight profit takings on shorts and puts, there exists the possibility of Big Hands trying to do consolidation today; slight rebound or consolidation can happen later during European trading hours as well as next Monday during Asian and European trading hours (1-2 trading days slight rebound). This is to add some noise, throw some smoke bomb and to add some confusion to market participants out there. 

Posture:
+ Big Hands' persistence in Puts (refer to chart above) coupled with switch to shorts this week are still showing signs of intentions: Short-Term Correction brewing VERY strong.
+ Market-Movers are still looking to execute short term sell-down on indices, index stocks, big cap stocks and mid cap stocks worldwide as per reiterated last week (Note: penny stocks and small caps do not need to respond to index/big market corrections).
Short-term Corrections are expected to be executed with more impulse; however, do bear in mind that mid-term worldwide market outlook is still upwave-biased despite this anticipated short term sell-down with potential force.

Side-Note:
Wisdom from Donovan Norfolk Ang: 

"Markets will ignore anything good, be it on the news side, fundamental side or technical side, as long as Big Hands are Shorts with Puts."

+ The following are the short term sell-down correction targets as per reiterated since last week:

(you might like to refer to the accompanying detailed analysis links below too):

1. Malaysian FKLI: 
1,790 points and a whipsaw just below 1790 points.

2. Hong Kong Hang Seng Index: 
22,770 points first target ---> TARGET HIT 8 NOV 2013
and 
22,000 points second target

3. UK FTSE100: 
6500-6550 points.

4. European Euro STOXX50: 
2804 points.

5. US NASDAQ Composite: 
3700 points.

7. EURUSD: 
1.34000 ---> TARGET HIT ON 7 NOV 2013 

8. GBPUSD: 
1.59000 as 1st target ---> TARGET HIT IN NOV 2013
and 
1.57000-1.57500 as 2nd target

9. NZDUSD: 
0.81000

10. AUD, NZD, EUR, GBP, JPY, CAD, CHF will generally be weak until the corrections end. 

+ FFA Litmus Test Results:
Short-term corrections are expected to be executed with more force now in International financial markets worldwide: Stocks, Equities, Indices, Commodities, Forex: EURUSD, GBPUSD, AUDUSD, NZDUSD, CANADIAN DOLLAR CAD, SWISS FRANC CHF AND JAPANESE YEN JPY, Gold, Silver, Crude Palm Oil and Crude Oil. These are, however, still within a mid-term relief rally bounce and any short term corrections are to be judged as healthy retracements within the larger mid-term upwaves.

+ Below are the much larger mid-term upwave targets that still hold:

+ Financial Markets, Commodities Markets, Oil, Gold, Silver and Forex markets (EURUSD, GBPUSD, Swiss Franc, Japanese Yen, Canadian Dollar, AUDUSD, NZDUSD) are still expected to have some more upside against the US Dollar, and this upside is expected to be healthy until I turn big reversal.

+ Expectations are still unchanged: FCPO 3000RM as target, Gold $1500-$1550 as first target and $1750-$1800 as second target, Silver $30.000 as target, Golden Agri (Palm Oil Stock) S$0.60 as 1st target and S$0.74 as 2nd target, AUDUSD $0.96 as first target and $1.00 parity as 2nd target, USDJPY ¥83.54-¥84.00 as final target, India CNX Nifty Index 6188-6320 as up-move target and break-out of 6320 points for uncharted rally as second target, and Oil $118.00-$120.00 as tentative target, FKLI 1900 points as target, or until I turn big reversal.

+ Special Note: 
Each of the respective asset class markets (Gold, Silver, Crude Oil, Palm Oil, Commodities, Forex, Stocks and Worldwide Stock Market Indices) have moved in my directions since.

+ So far, only Indian Nifty Index, AUDUSD has hit initial targets as above listed. 
+ More upsides in worldwide financial markets (Stocks, Equities, Indices, Commodities, Forex: EURUSD, GBPUSD, AUDUSD, NZDUSD, CANADIAN DOLLAR CAD, SWISS FRANC CHF AND JAPANESE YEN JPY, Gold, Silver, Crude Palm Oil and Crude Oil)  are still expected after this short term correction selldown (refer past analyses).
+ Japan's QE effects are wearing out, Nikkei-225 may become the weakest link of international financial markets when the rising tide ends.

Broad/Big Market (Big Wind Direction) Long Term Outlook by Big Hands:

All Markets are currently attempting to negate long term bear structures.
The depth of this anticipated short term sell-down will reveal clearer skies and whether previous long term outlook still hold.

-----------------------------------------------------------------------------------------------------------------
Donovan Big Hands Funds Flow Computational Oscillator
-----------------------------------------------------------------------------------------------------------------

Donovan's Funds Flow Analysis Index Oscillator:
-10 ----- 0 ------+10
Donovan's Funds Flow Analysis Strength-Index Scale Key:
negative (-ve) = shorting;
positive (+ve) = longing;
0: No shorts and no longs (direction-less)
1-2: Weak strength / weak holdings
3-4: Moderate strength / moderate holdings
5-6: Strong strength / high holdings
7-8:Very strong strength / very high holdings
9-10:: Rally Mode in store if +ve / Plunging Mode in store if -ve

Implication of Broad Markets/Big Markets/Big Wind Indices Directions
If it is a rising tide in Index Big Wind, most or almost all stock boats generally rise;
If it is a receding tide in Index Big Wind, most or almost all stock boats generally go lower.
Hence the importance of Big Wind Directions blown by Big Hands.


Thursday, 7 November 2013

Funds Flow Analysis (FFA): 7 November 2013, Thursday, 5.15pm Singapore Time


Current Latest Computed Funds Flow Analysis (FFA):
For Worldwide Financial Markets:
7 November 2013, Thursday, 5.15pm Singapore Time
The Donovan Norfolk Ang Funds Flow Analysis Indicator 
for Worldwide Financial Markets 
7 November 2013, Thursday

Broad Markets / Big Markets / Big Wind Directions

European markets are in the first 1 hour 15 minutes of trading, while US markets (Dow, S&P500 and NASDAQ) are 5 hours 15 minutes away from the opening bell. 

Based on current latest computational results, Holdings Index Strength of Big Hands changed from -3.745 to -4.512 in strength on the Donovan Norfolk Funds Flow Index OscillatorOn the other front, Big Hands' Puts holdings on hand changed from -5.097 to -5.592 in strength on the Donovan Norfolk Funds Flow Index Oscillator. 

Broad/Big Market (Big Wind Direction) Short-Term / Mid-Term Posture by Big Hands:

+ I warned yesterday night (Singapore time) in my Facebook Wall that despite any overnight US attempt to rally, Asia and Europe will proceed to sell down: this move to kill naive traders/market participants was executed today.
+ In essence, the continued sell-down came per expected today despite yesterday that US tried to do a rally.
+ Markets will ignore anything good, be it on the news side, fundamental side or technical side, as long as Big Hands are Shorts with Puts.
+ Big Hands continue to execute sells for the 5th consecutive trading day (since last Friday) while holding bloated amount of PUTS (something brewing short term and for which one has to be cautious of).
+ Big Hands are dual sells today.
+ Big Hands' Puts since last week are now in the money (i.e. currently in profits).
+ Big Hands' Short-Term Shorts in Holdings have now become shorts of some strength
+ Majority of Big Hands' Bearish PUTS are still held in place
+ Not only majority of Bearish Puts are held in place, Big Hands carried on piling up Puts today.
+ Big Hands' persistence in Puts (refer to chart above) coupled with switch to shorts are now showing signs of intentions: Short-Term Correction brewing VERY strong.
+ Market-Movers are still looking to execute short term sell-down on indices, index stocks, big cap stocks and mid cap stocks worldwide as per reiterated last week (Note: penny stocks and small caps do not need to respond to index/big market corrections).
Short-term Corrections are expected to be executed with more impulse; however, do bear in mind that mid-term worldwide market outlook is still upwave-biased despite this anticipated short term sell-down with potential force.

Side-Note:
Somebody was lost today so this was my reply in terms of an analogy, also adapted from my Facebook Wall Wisdom:

"let's say markets move up 4 months by 10,000 metres, corrects down 2 months short-term by 5,000 metres, and then rallies another 10,000 metres using another 4months. In this 10 months mid-term, it has moved up 15,000metres with 5,000 metres of noise. Yet, if one runs long at the 9,999th metre upmove mark, one will get whipsawed nastily at the opposite direction by a healthy 5001 metres correctional rest; even though one is correct, one can still get smoked and confused by the noises which is what is happening now. This is how financial markets operate: when everyone sees a trend, everyone will tossed in am abrupt vertigo, so that they see wrongly even though they may be right."

+ The following are the short term sell-down correction targets as per reiterated since last week:

(you might like to refer to the accompanying detailed analysis links below too):

1. Malaysian FKLI: 1,790 points and a whipsaw just below 1790 points.(refer: http://donovan-ang.blogspot.sg/2013/10/fkli-index-25-october-2013-1215pm.html
2. Hong Kong Hang Seng Index: 22,000 points and 22,770 points (http://donovan-ang.blogspot.sg/2013/11/hang-seng-index-6-november-2013.html)
3. UK FTSE100: 6500-6550 points.
4. European Euro STOXX50: 2804 points.
5. US NASDAQ Composite: 3700 points.
8. GBPUSD (BritishPound-USD): 1.59000 as 1st target and 1.57000-1.57500 as 2nd target
9. NZDUSD (NewZealandDollar-USD): 0.81000
9. AUD, NZD, EUR, GBP, JPY, CAD, CHF will generally be weak until the corrections end. 

+ FFA Litmus Test Results:
Short-term corrections are expected to be executed with more force now in International financial markets worldwide: Stocks, Equities, Indices, Commodities, Forex: EURUSD, GBPUSD, AUDUSD, NZDUSD, CANADIAN DOLLAR CAD, SWISS FRANC CHF AND JAPANESE YEN JPY, Gold, Silver, Crude Palm Oil and Crude Oil. These are, however, still within a mid-term relief rally bounce and any short term corrections are to be judged as healthy retracements within the larger mid-term upwaves.

+ Below are the much larger mid-term upwave targets that still hold:

+ Financial Markets, Commodities Markets, Oil, Gold, Silver and Forex markets (EURUSD, GBPUSD, Swiss Franc, Japanese Yen, Canadian Dollar, AUDUSD, NZDUSD) are still expected to have some more upside against the US Dollar, and this upside is expected to be healthy until I turn big reversal.

+ Expectations are still unchanged: FCPO 3000RM as target, Gold $1500-$1550 as first target and $1750-$1800 as second target, Silver $30.000 as target, Golden Agri (Palm Oil Stock) S$0.60 as 1st target and S$0.74 as 2nd target, AUDUSD $0.96 as first target and $1.00 parity as 2nd target, USDJPY ¥83.54-¥84.00 as final target, India CNX Nifty Index 6188-6320 as up-move target and break-out of 6320 points for uncharted rally as second target, and Oil $118.00-$120.00 as tentative target, FKLI 1900 points as target, or until I turn big reversal.

+ Special Note: 
Each of the respective asset class markets (Gold, Silver, Crude Oil, Palm Oil, Commodities, Forex, Stocks and Worldwide Stock Market Indices) have moved in my directions since.

+ So far, only Indian Nifty Index, AUDUSD has hit initial targets as above listed. 
+ More upsides in worldwide financial markets (Stocks, Equities, Indices, Commodities, Forex: EURUSD, GBPUSD, AUDUSD, NZDUSD, CANADIAN DOLLAR CAD, SWISS FRANC CHF AND JAPANESE YEN JPY, Gold, Silver, Crude Palm Oil and Crude Oil)  are still expected after this short term correction selldown (refer past analyses).
+ Japan's QE effects are wearing out, Nikkei-225 may become the weakest link of international financial markets when the rising tide ends.

Broad/Big Market (Big Wind Direction) Long Term Outlook by Big Hands:

All Markets are currently attempting to negate long term bear structures.
The depth of this anticipated short term sell-down will reveal clearer skies and whether previous long term outlook still hold.

-----------------------------------------------------------------------------------------------------------------
Donovan Big Hands Funds Flow Computational Oscillator
-----------------------------------------------------------------------------------------------------------------

Donovan's Funds Flow Analysis Index Oscillator:
-10 ----- 0 ------+10
Donovan's Funds Flow Analysis Strength-Index Scale Key:
negative (-ve) = shorting;
positive (+ve) = longing;
0: No shorts and no longs (direction-less)
1-2: Weak strength / weak holdings
3-4: Moderate strength / moderate holdings
5-6: Strong strength / high holdings
7-8:Very strong strength / very high holdings
9-10:: Rally Mode in store if +ve / Plunging Mode in store if -ve

Implication of Broad Markets/Big Markets/Big Wind Indices Directions
If it is a rising tide in Index Big Wind, most or almost all stock boats generally rise;
If it is a receding tide in Index Big Wind, most or almost all stock boats generally go lower.
Hence the importance of Big Wind Directions blown by Big Hands.


Wednesday, 6 November 2013

Funds Flow Analysis (FFA): 6 November 2013, Wednesday, 4.30pm Singapore Time


Current Latest Computed Funds Flow Analysis (FFA):
For Worldwide Financial Markets:
6 November 2013, Wednesday, 4.30pm Singapore Time

The Donovan Norfolk Ang Funds Flow Analysis Indicator 
for Worldwide Financial Markets 
6 November 2013, Wednesday


Broad Markets / Big Markets / Big Wind Directions

European markets are in the first 30 minutes of trading, while US markets (Dow, S&P500 and NASDAQ) are 6 hours 00 minutes away from the opening bell. 

Based on current latest computational results, Holdings Index Strength of Big Hands changed from -1.986 to -3.745 in strength on the Donovan Norfolk Funds Flow Index OscillatorOn the other front, Big Hands' Puts holdings on hand changed from -6.267 to -5.097 in strength on the Donovan Norfolk Funds Flow Index Oscillator. 

Broad/Big Market (Big Wind Direction) Short-Term / Mid-Term Posture by Big Hands:

+ Big Hands continue to execute sells for the 4th consecutive trading day (since last Friday) and doing so, while holding bloated amount of PUTS, without causing much price change (something is brewing short term and for which one has to be cautious of).
+ Big Hands' Puts since last week are in the money (i.e. in profits).
+ Big Hands took slight profits of PUTS today.
+ Big Hands' Shorts in Holdings have now become shorts of some strength
+ Majority of Big Hands' Bearish PUTS are still held in place
+ Big Hands' persistence in Puts (refer chart above) coupled with switch to shorts are now showing signs of intentions: Short-Term Correction brewing strong now.
+ Market-Movers are still looking to execute short term sell-down on indices, index stocks, big cap stocks and mid cap stocks worldwide as per reiterated last week.
Short-term Corrections are expected to be executed with more force now; however, do bear in mind that mid-term worldwide market outlook is still upwave-biased despite this anticipated short term sell-down with potential force.

+ As the Puts kept on increasing, short-term corrections within the larger mid-term upwave is expected to be in place now. The following are the short term sell-down correction targets as per reiterated since last week:

(you might like to refer to the accompanying detailed analysis links below too):

1. Malaysian FKLI: 1,790 points and a whipsaw just below 1790 points.(refer: http://donovan-ang.blogspot.sg/2013/10/fkli-index-25-october-2013-1215pm.html
2. Hong Kong Hang Seng Index: 22,000 points and 22,770 points (http://donovan-ang.blogspot.sg/2013/11/hang-seng-index-6-november-2013.html)
3. UK FTSE100: 6500-6550 points.
4. European Euro STOXX50: 2804 points.
5. US NASDAQ Composite: 3700 points.
8. GBPUSD (BritishPound-USD): 1.59000 as 1st target and 1.57000-1.57500 as 2nd target
9. NZDUSD (NewZealandDollar-USD): 0.81000
9. AUD, NZD, EUR, GBP, JPY, CAD, CHF will generally be weak until the corrections end. 

+ FFA Litmus Test Results:
Short-term corrections are expected to be executed with more force now in International financial markets worldwide: Stocks, Equities, Indices, Commodities, Forex: EURUSD, GBPUSD, AUDUSD, NZDUSD, CANADIAN DOLLAR CAD, SWISS FRANC CHF AND JAPANESE YEN JPY, Gold, Silver, Crude Palm Oil and Crude Oil. These are, however, still within a mid-term relief rally bounce and any short term corrections are to be judged as healthy retracements within the larger mid-term upwaves.

+ Below are the much larger mid-term upwave targets that still hold:

+ Financial Markets, Commodities Markets, Oil, Gold, Silver and Forex markets (EURUSD, GBPUSD, Swiss Franc, Japanese Yen, Canadian Dollar, AUDUSD, NZDUSD) are still expected to have some more upside against the US Dollar, and this upside is expected to be healthy until I turn big reversal.

+ Expectations are still unchanged: FCPO 3000RM as target, Gold $1500-$1550 as first target and $1750-$1800 as second target, Silver $30.000 as target, Golden Agri (Palm Oil Stock) S$0.60 as 1st target and S$0.74 as 2nd target, AUDUSD $0.96 as first target and $1.00 parity as 2nd target, USDJPY ¥83.54-¥84.00 as final target, India CNX Nifty Index 6188-6320 as up-move target and break-out of 6320 points for uncharted rally as second target, and Oil $118.00-$120.00 as tentative target, FKLI 1900 points as target, or until I turn big reversal.

+ Special Note: 
Each of the respective asset class markets (Gold, Silver, Crude Oil, Palm Oil, Commodities, Forex, Stocks and Worldwide Stock Market Indices) have moved in my directions since.

+ So far, only Indian Nifty Index, AUDUSD has hit initial targets as above listed. 
+ More upsides in worldwide financial markets (Stocks, Equities, Indices, Commodities, Forex: EURUSD, GBPUSD, AUDUSD, NZDUSD, CANADIAN DOLLAR CAD, SWISS FRANC CHF AND JAPANESE YEN JPY, Gold, Silver, Crude Palm Oil and Crude Oil)  are still expected after this short term correction selldown (refer past analyses).
+ Japan's QE effects are wearing out, Nikkei-225 may become the weakest link of international financial markets when the rising tide ends.

Broad/Big Market (Big Wind Direction) Long Term Outlook by Big Hands:

All Markets are currently attempting to negate long term bear structures.
The depth of this anticipated short term sell-down will reveal clearer skies and whether previous long term outlook still hold.

-----------------------------------------------------------------------------------------------------------------
Donovan Big Hands Funds Flow Computational Oscillator
-----------------------------------------------------------------------------------------------------------------

Donovan's Funds Flow Analysis Index Oscillator:
-10 ----- 0 ------+10
Donovan's Funds Flow Analysis Strength-Index Scale Key:
negative (-ve) = shorting;
positive (+ve) = longing;
0: No shorts and no longs (direction-less)
1-2: Weak strength / weak holdings
3-4: Moderate strength / moderate holdings
5-6: Strong strength / high holdings
7-8:Very strong strength / very high holdings
9-10:: Rally Mode in store if +ve / Plunging Mode in store if -ve

Implication of Broad Markets/Big Markets/Big Wind Indices Directions
If it is a rising tide in Index Big Wind, most or almost all stock boats generally rise;
If it is a receding tide in Index Big Wind, most or almost all stock boats generally go lower.
Hence the importance of Big Wind Directions blown by Big Hands.


Hang Seng Index: 6 November 2013, Wednesday, 2.05pm Singapore Time

Hang Seng Index: 6 November 2013, Wednesday, 8.59am Singapore Time

Attached is the Hourly Chart of Hong Kong Hang Seng Index in addition to the Daily Chart attached earlier.

ADDED MORE SHORTS ON HANG SENG INDEX AT 23071 POINTS.

Hang Seng Index Analysis:

1. PINK BEARISH FAN
2. ORANGE SUPPRESSION RESISTANCE
3. MID-CHANNEL SUPPORT LINE BREAK-DOWN AS ABOVE: HANG SENG BECOMES SHORT ON REBOUND FOR THIS SHORT TERM CORRECTION

Asia is expected to lead the stock markets sell-down during this short term correction which I had warned in advance last week. Worldwide short-term corrections of International Financial Markets are awaiting for full execution.

Short-term:
Bearish Biased Sell-Down


Hang Seng Index: 6 November 2013, Wednesday, 8.59am Singapore Time

Hang Seng Index: 6 November 2013, Wednesday, 8.59am Singapore Time

Attached is the Daily Chart of Hong Kong Hang Seng Index.

Hang Seng Index has met with a power triple resistance to trigger the short term sell-down:

1. PINK MID-LONG TERM RESISTANCE AT 23200-23500 POINTS REGION.
2. CLASSICAL RESISTANCE AT 23511.5 POINTS.
3. UP-CHANNEL SUPPORT-TURNED-RESISTANCE AT 23100 POINTS AREA.
4. DNA FUNDS FLOW ANALYSIS DAILY CALCULATIONS AND CARDS-COUNTING OF BIG HANDS MOVEMENT INDICATE THAT IN THE WORLDWIDE FINANCIAL MARKETS, BIG HANDS SWITCHED TO SOME SHORTS AND POSSESS BLOATED AMOUNTS OF PUTS.

Asia is expected to lead the stock markets sell-down during this short term correction which I had warned in advance last week. Worldwide short-term corrections of International Financial Markets are awaiting for full execution.

Short-term:
Bearish Biased Sell-Down


Tuesday, 5 November 2013

USDJPY Weekly Chart: 5 November 2013, Tuesday, 5.00pm Singapore Time

USDJPY Weekly Chart: 5 November 2013, Tuesday, 5.00pm Singapore Time

I deem the coast is clear for adding more SHORTS ON USDJPY again.

Established 8th Batch of Shorts on USDJPY at ¥98.249
Still holding on to all my first 7 batches of USDJPY Shorts

(Reverse Technical Analysis)

Maintains Target of ¥83.54
(Target profit of more than 1500 pips per contract)

I am buying Japanese Yen when everybody is shorting Japanese Yen
*Note: Buy JPY/USD = Short USD/JPY 


Refer to all live USDJPY trading below: