Ticker 1

Ticker 2

Click "Like" to Receive First Hand Updates From The Analysis Site / Click "SHARE" to share

Wednesday, 31 July 2019

Super Cycle of SGDMYR: 31 July 2019, Wednesday


Super Cycle of SGDMYR:
31 July 2019, Wednesday
(Click on the Technical Chart Above to Expand)

Attached is the SuperCycle Technicals for SGDMYR, i.e. the Singapore Dollar priced in Malaysia Ringgit. Upmove in SGDMYR chart means Singapore Dollar going up against Malaysia Ringgit, or alternatively it also means Malaysian Ringgit going down against Singapore Dollar. Observe the red circles, orange circles and yellow circles to know why this is a high quality technicals as charted. The Malaysian Ringgit is on its way towards the collision region soon, as illustrated on chart. Since the technical chart is mathematically logarithmic in scale, the red lined region representing Turmoil Level could be far above SGDMYR of 5.00, and easily more than SGDMYR of 6.00.

Donovan Norfolk Technical Rating for SGDMYR:
Extremely Bullish for SGD with respect to MYR
Extremely Bearish for MYR with respect to SGD

DISCLAIMER

This analysis site, as well as the analyses in it, is created for the sole purpose of education, discussion, fundamental analysis knowledge sharing, technical analysis knowledge sharing, funds flow analysis knowledge sharing, general skills-knowledge sharing and opinions sharing. The contents of this blog are not to be taken as investment advice or inducement to trade, and I take no responsibility for any gains or losses as a result of reading my analyses, judgements and opinions. In essence, practise due diligence. 

Samsung Electronics (Implication: Trade War is Over): 31 July 2019, Wednesday


Samsung Electronics (Listed in Korea and UK-London):
31 July 2019, Wednesday
(Click on the Technical Chart Above to Expand)

Attached is the Technicals for Samsung Electronics. The corrective wave has ended with a break-up in the orange circled region as shown. The impulsive wave as illustrated is resuming. This also has certain implications. In the chips, technology (TECH) and electronics industries, the impulsive wave up is resuming now. While the world of silly herd is selling because the media tells you that recession is coming, the world of highly intelligent smart monies are buying from you -- in the financial markets. While you sell on bad news, professionals buy on bad news strategically. The worst is finally over for chips, semiconductor and hardware-electronics sectors. The trade war is no more.

Donovan Norfolk Technical Rating for Worldwide Equity Markets:
Bullish

DISCLAIMER

This analysis site, as well as the analyses in it, is created for the sole purpose of education, discussion, fundamental analysis knowledge sharing, technical analysis knowledge sharing, funds flow analysis knowledge sharing, general skills-knowledge sharing and opinions sharing. The contents of this blog are not to be taken as investment advice or inducement to trade, and I take no responsibility for any gains or losses as a result of reading my analyses, judgements and opinions. In essence, practise due diligence. 

Monday, 29 July 2019

Straits Times Index (STI): 29 July 2019, Monday


Straits Times Index (STI):
29 July 2019, Monday
(Click on the Technical Chart Above to Expand)

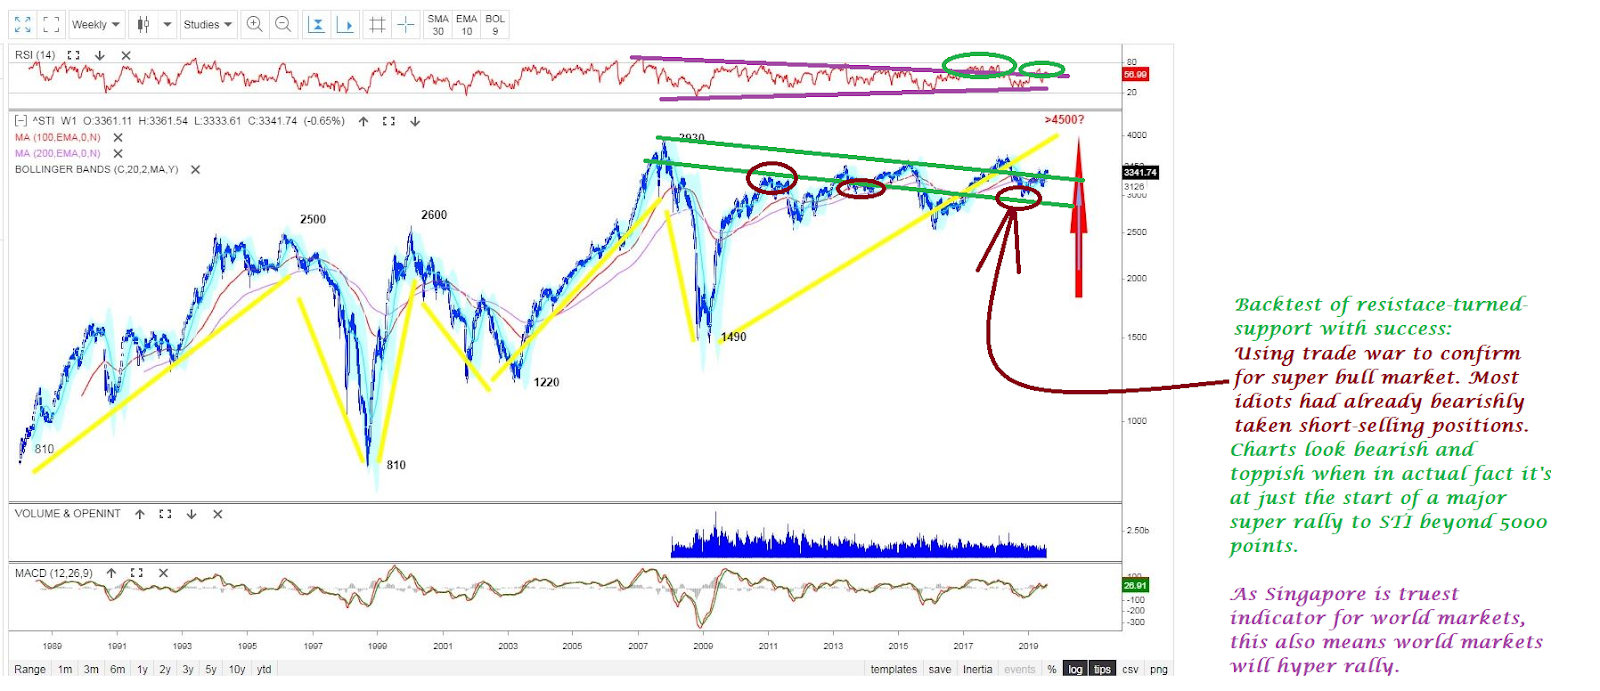
Attached is the Technicals for Singapore Straits Times Index (STI). The final brown circled region is the backtest of critical resistance-turned-support with success. The backtest confirmation of huge bull market was achieved using trade war as the fake smoke screen, i.e. to throw the 90% market herd majority into disarray and run for shelter while markets are to dump them behind. It is also an operation to lure market majority to short-sell the financial markets. Most people had already sold, left, short-sold or gone into bearish recession mode. The Straits Times Index is ready to go beyond 5000 points. As Singapore is world's barometer for financial market performances, this also means worldwide equity markets are going to hyper rally.

Donovan Norfolk Technical Rating for Worldwide Equity Markets:
Bullish

DISCLAIMER

This analysis site, as well as the analyses in it, is created for the sole purpose of education, discussion, fundamental analysis knowledge sharing, technical analysis knowledge sharing, funds flow analysis knowledge sharing, general skills-knowledge sharing and opinions sharing. The contents of this blog are not to be taken as investment advice or inducement to trade, and I take no responsibility for any gains or losses as a result of reading my analyses, judgements and opinions. In essence, practise due diligence. 

Saturday, 27 July 2019

Technicals of Lear Corp (NYSE: LEA): 27 July 2019, Saturday


Technicals of Lear Corp (NYSE: LEA):
27 July 2019, Saturday
(Click on the Technical Chart Above to Expand)

Attached is the Technicals of Lear Corp, an auto parts company that is listed in the NYSE.
This is another example of companies that are hurt badly by Trump's trade policies. Bump and Run lines are illustrated in black. First red circled region is where confirmation of end of bump operations ended. Dumping phase is technically illustrated by 2nd red arrow as shown on chart. The light-orange circled region is where end of bump and run distribution occurred, based on technicals and volume flow. This would be followed by large downtrend in price actions. The dark brown circled region is where backtest of support-turned-resistance confirms much more bearish move down to come for this company (we can expect more bearish corporate results to come for this company). The series of volume flow as illustrated will triple confirm that there will be more bearish moves by smart monies on Lear Corp. This would make for a great short-sell stock to protect (hedge) one's portfolio of longs investments/holdings.

The Donovan Norfolk Technical Rating:
Bearish

DISCLAIMER

This analysis site, as well as the analyses in it, is created for the sole purpose of education, discussion, fundamental analysis knowledge sharing, technical analysis knowledge sharing, funds flow analysis knowledge sharing, general skills-knowledge sharing and opinions sharing. The contents of this blog are not to be taken as investment advice or inducement to trade, and I take no responsibility for any gains or losses as a result of reading my analyses, judgements and opinions. In essence, practise due diligence. 

Tuesday, 23 July 2019

Updated Technicals of Wilmar International: 23 July 2019, Tuesday


Updated Technicals of Wilmar International:
23 July 2019, Tuesday
(Click on the Technical Chart Above to Expand)

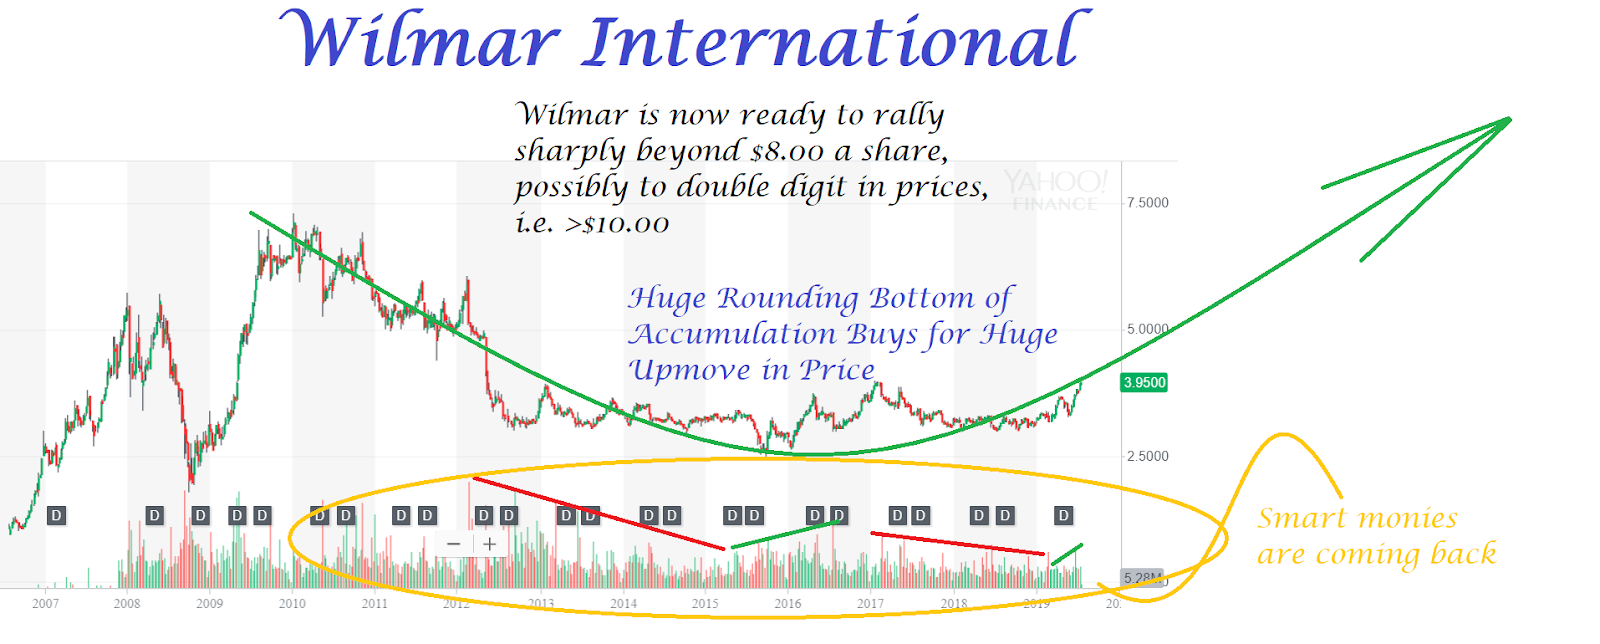
Attached is the Updated Technicals of Wilmar International. Wilmar has completed the huge rounding bottom of massive accumulation. This is a brew for very large wave up. Palm oil and palm oil stocks worldwide are looking at this industry leader closely too. Wilmar is now ready to rally big time to way beyond $8.00 a share -- possibly to double digit in prices, i.e. >$10.00 a share. Only a rally to beyond $10 a share will make the huge massive accumulation (See Volume Flow in Chart) worth it.

The Donovan Norfolk Technical Rating:
Bullish


DISCLAIMER

This analysis site, as well as the analyses in it, is created for the sole purpose of education, discussion, fundamental analysis knowledge sharing, technical analysis knowledge sharing, funds flow analysis knowledge sharing, general skills-knowledge sharing and opinions sharing. The contents of this blog are not to be taken as investment advice or inducement to trade, and I take no responsibility for any gains or losses as a result of reading my analyses, judgements and opinions. In essence, practise due diligence. 
Monday, 22 July 2019

Updated Gold Weekly Chart Technicals: 22 July 2019, Monday


Updated Gold Weekly Chart Technicals:
22 July 2019, Monday
(Click on the Technical Chart Above to Expand)

Attached is the macroscopic Technicals for Gold. As per reiterated in the past years:

1. When stocks are bullish, Gold will rise with the bull markets gradually to beyond $2000 an ounce.

2. When stocks are bearish, Gold will rise sharply beyond $2000 an ounce. Gold's super ascent is assured based on technicals and the dynamics of the current economic cycle.

3. Gold's rise to backtest a previous $1550-$1600 (previous neckline) resistance was a guarantee based on standard technical model.

Lastly, because Gold's re-accumulation (see region in light green) was very massive and deliberate, $1550-$1600 resistance will crack easily. An investment target price of $2500-$3000 can be expected based on technical projection. Any backtest at $1371 will see massive buy pressure from smart monies worldwide. This would be the next buy adding point before the next great rise.


The Donovan Norfolk Technical Rating:
Bullish short term, mid term and long term.


DISCLAIMER

This analysis site, as well as the analyses in it, is created for the sole purpose of education, discussion, fundamental analysis knowledge sharing, technical analysis knowledge sharing, funds flow analysis knowledge sharing, general skills-knowledge sharing and opinions sharing. The contents of this blog are not to be taken as investment advice or inducement to trade, and I take no responsibility for any gains or losses as a result of reading my analyses, judgements and opinions. In essence, practise due diligence. 

China A50 Index reflecting the Chinese Stock Markets: 22 July 2019, Monday

China A50 Index reflecting the Chinese Stock Markets:
22 July 2019, Monday
(Click on the Technical Chart Above to Expand)

Attached is the updated Daily Technicals of China A50 Index. China markets are one of the weakest in the world, and even it is showing strength when most analysts and majority of the markets are bearish in outlook. The yellow lines depict region of bull flag which had achieved short term breakout. The mid term is a consolidation, while the long term remains uptrend. Although many people are talking about technical recession for most markets worldwide, we are not in any bear market nor true recession. Markets will even super rally and dump market majority behind. The trailing line in ichimoku is even persistently above clouds and currently we are seeing green clouds for the lookahead. The green circled region is where clouds deliberately support even weakest markets.

Outlook for worldwide markets: Bullish 
(When even weakest is supported with buying pressure, everyone is on rising tide that lifts all boats high).

DISCLAIMER
This analysis site, as well as the analyses in it, is created for the sole purpose of education, discussion, fundamental analysis knowledge sharing, technical analysis knowledge sharing, funds flow analysis knowledge sharing, general skills-knowledge sharing and opinions sharing. The contents of this blog are not to be taken as investment advice or inducement to trade, and I take no responsibility for any gains or losses as a result of reading my analyses, judgements and opinions. In essence, practise due diligence. 
Wednesday, 17 July 2019

Development Bank of Singapore (DBS): 17 July 2019, Wednesday

Development Bank of Singapore (DBS):
17 July 2019, Wednesday
(Click on the Technical Chart Above to Expand)

Attached is the updated Technicals of Development Bank of Singapore (DBS) that is listed in Singapore. It is the Donovan Norfolk Top Rated Stock of Singapore. DBS has successfully tested the Supercycle resistance-turned-support as indicated. DBS is preparing for Supercycle upmove. Supercycle upmove means: 1. Targets of $40.00 and $53.42 respectively; 2. Very big fat dividends very regularly. The green circled region highlights, based on technicals, how one is silly if one used Trump's trade war to sell.

DISCLAIMER
This analysis site, as well as the analyses in it, is created for the sole purpose of education, discussion, fundamental analysis knowledge sharing, technical analysis knowledge sharing, funds flow analysis knowledge sharing, general skills-knowledge sharing and opinions sharing. The contents of this blog are not to be taken as investment advice or inducement to trade, and I take no responsibility for any gains or losses as a result of reading my analyses, judgements and opinions. In essence, practise due diligence. 

Tuesday, 16 July 2019

Hang Seng Index: 16 July 2019, Tuesday

Hang Seng Index:
16 July 2019, Tuesday
(Click on the Technical Chart Above to Expand)

Attached is the updated Technicals for Hang Seng Index.
All important illustrations are as on Technical Chart attached.
Click on the Technical Chart to expand.

DISCLAIMER
This analysis site, as well as the analyses in it, is created for the sole purpose of education, discussion, fundamental analysis knowledge sharing, technical analysis knowledge sharing, funds flow analysis knowledge sharing, general skills-knowledge sharing and opinions sharing. The contents of this blog are not to be taken as investment advice or inducement to trade, and I take no responsibility for any gains or losses as a result of reading my analyses, judgements and opinions. In essence, practise due diligence. 

Dow Jones Industrial Average: 16 July 2019, Tuesday


Dow Jones Industrial Average:
16 July 2019, Tuesday
(Click on the Technical Chart Above to Expand)

Attached is the updated Technicals for Dow Jones Industrial Average. The first brown circled region is my December 2018 live fore-warnings to buy on the fear while everyone shorted, sold or called to exit the markets. I had forewarned of hyper rallies when the 95% herd were filled with fear. DJIA has now rallied more than 5000 points per contract since my forewarned analyses. The 2nd circled regions were my reiteration to keep buying even when we entered into 1st two weeks of January 2019. Markets have since buoyed beyond my buy points. The DJIA has now further broken up the orange resistance, even making 2 weeks of backtests for this breakup. Refer to technical chart to know what this means. The breakup confirmation has also been achieved last week. Most people had been bearish and shorting equity markets right now. All the more better.

DISCLAIMER
This analysis site, as well as the analyses in it, is created for the sole purpose of education, discussion, fundamental analysis knowledge sharing, technical analysis knowledge sharing, funds flow analysis knowledge sharing, general skills-knowledge sharing and opinions sharing. The contents of this blog are not to be taken as investment advice or inducement to trade, and I take no responsibility for any gains or losses as a result of reading my analyses, judgements and opinions. In essence, practise due diligence. 

Monday, 15 July 2019

Sembcorp Marine: 15 July 2019, Monday

Sembcorp Marine:
15 July 2019, Monday
(Click on the Technical Chart Above to Expand)

Attached is the updated Technicals for Sembcorp Marine that is listed in the Singapore SGX. Sembcorp Marine is currently at the secular cycle support and attempting to consolidate in a long term big double bottom as a new trajectory. This is illustrated in as Region B on technical chart. Region B price range (accumulation) is coincidentally a price satisfaction on Region A distribution. The entire series of trajectory is now not only symmetrical in price action Y-axis, it is now approaching symmetry in X-axis time line as well. This means Sembcorp Marine will resume its large uptrend from here, i.e. it is likely to break up $3.00 resistance (+100% profits from here), and eventually re-test $6.00 resistance. We are still in large bull market worldwide which will raise almost all boats.

DISCLAIMER
This analysis site, as well as the analyses in it, is created for the sole purpose of education, discussion, fundamental analysis knowledge sharing, technical analysis knowledge sharing, funds flow analysis knowledge sharing, general skills-knowledge sharing and opinions sharing. The contents of this blog are not to be taken as investment advice or inducement to trade, and I take no responsibility for any gains or losses as a result of reading my analyses, judgements and opinions. In essence, practise due diligence. 

Tuesday, 2 July 2019

Lendlease Group (ASX: LLC), Australian Economy and Australian Dollar In General

Lendlease Group (ASX: LLC):
2 July 2019, Tuesday
(Click on the Technical Chart Above to Expand)

Attached is the Technicals for Lendlease Group which a number of people had bought and asked me about it today. The below are my opinions and for your learning:

Firstly, I had reiterated before that I do not like property stocks in general under the current economic cycle for which the interest rate cycle is not conducive to property companies and property construction companies.

Secondly, I had reiterated many times that, in my opinion, Australia will be economically punished by China -- the largest trading partner of Australia when it comes to GDP/money-making for Australia. While US is able to give economic sanctions, China does the same too. In China's perspective, Australia was instrumental in pushing the US to block and ban Huawei, and this caused China and Huawei immense losses which would not be forgiven by China easily -- this is not difficult to deduce based on logic.

This means Chinese monies which were mainly responsible for the largest and longest economic boom of Australia is a "goodbye for Australia" now and within the next few years too. So will be the same for Aussie Property Markets.

Next, look at Australia's key trading partner statistics below to know how economically important China is to Australia:

China: US$74 billion (29.2% of total Australian exports to China)
Japan: $26.2 billion (10.3%)
South Korea: $13.6 billion (5.4%)
India: $10.1 billion (4%)
United States: $9.2 billion (3.6%)
Hong Kong: $7.9 billion (3.1%)
New Zealand: $7.1 billion (2.8%)
Taiwan: $6.7 billion (2.6%)

Almost 1/3 of whatever Australia sells ends up in China. And only 3% of what Australia sells ends up in US, at a time when Donald Trump wants to use tariff to collect money from most of his trading partners, making an already harsh environment worse for Australia.

The technical chart of Lendlease Group further supports my point. All illustrations are as attached on technical chart. Key points on technical chart -- impulsive wave is down (true direction); corrective wave is up (fake direction); breakdown of large dead cat bounce channel in brown which took its time to suck in immense amount of fools' monies, followed by impulsive breakdown below brown channel's dead cat bounce; subtle supercycle down for Lendlease Group LLC as shown on chart; current execution of subtle dead cat bounce which continues to suck in fools' monies. This is a red-flag stock. There is another at least -50% wealth destruction for this company. 

The following is a generalised extrapolation of my thoughts:
This is a company which is a company within an entire industry (and possibly industries) being punished quietly by the very rich Chinese State Corporations and Chinese Monies who felt the pinch from the American Trade War. While China has to be more restrained towards US, the same cannot be said for Australia (especially when China lets Australia earn a lot of money, and does feel the sharp pain because of Huawei now, and Australia was recognised by China as one of the major contributors to this Huawei/5G jeopardy and pain).

All in all, because of the numerous deduced logic based on all the events until now, Australia and Australian currency are not expected to perform well at all in 2019, 2020 and possibly 2021 when compared to ASEAN or other emerging markets which had managed to stand neutral in the trade war. A wrong move caught in between the bouts exchanged by the 2 giants of US and China will normally land oneself into Intensive Care Unit (ICU). Unfortunately, Australia happened to walk in, and then become an unfortunate casualty.


DISCLAIMER

This analysis site, as well as the analyses in it, is created for the sole purpose of education, discussion, fundamental analysis knowledge sharing, technical analysis knowledge sharing, funds flow analysis knowledge sharing, general skills-knowledge sharing and opinions sharing. The contents of this blog are not to be taken as investment advice or inducement to trade, and I take no responsibility for any gains or losses as a result of reading my analyses, judgements and opinions. In essence, practise due diligence. 

Wednesday, 26 June 2019

Berkshire Hathaway (NYSE: BRK-A): 26 June 2019, Wednesday

Berkshire Hathaway (NYSE: BRK-A):
26 June 2019, Wednesday
(Click on the Technical Chart Above to Expand)

Attached is the Technicals for Berkshire Hathaway Class A Shares (NYSE: BRK-A). The triple X in the technicals shows the proportionate steady-rate growth, to the point that not only the measurement of each X on the vertical Y-axis is the same, even the slopes of the angles are the same. This shows that smart monies are consistently flowing in to this stock. Berkshire Hathaway is currently executing a large and significant Bull Flag in the form of a bullish ascending triangle. It is currently at the support base of the large scale bull flag. The next target based on X is $475,000-$500,000.


The Donovan Norfolk Technical Rating:
Bullish short term, mid term and long term.
Berkshire Hathaway is a strong buy for a trading position.


DISCLAIMER

This analysis site, as well as the analyses in it, is created for the sole purpose of education, discussion, fundamental analysis knowledge sharing, technical analysis knowledge sharing, funds flow analysis knowledge sharing, general skills-knowledge sharing and opinions sharing. The contents of this blog are not to be taken as investment advice or inducement to trade, and I take no responsibility for any gains or losses as a result of reading my analyses, judgements and opinions. In essence, practise due diligence. 

Tuesday, 25 June 2019

Gold, Gold Stocks and Gold ETFs: 25 June 2019, Tuesday


Gold Daily Chart Technicals:
14 June 2019, Friday
(Click on the Technical Chart Above to Expand)

Attached is the more macroscopic Technicals for Gold. As per reiterated in the past years, in this economic cycle of the new normal:

1. When stocks are bullish, Gold will rise with the bull market gradually to beyond $2000 an ounce.

2. When stocks are bearish, Gold will rise even faster and sharply beyond $2000 an ounce. Gold becomes 100% sure-winner.

3. Gold's rise to backtest a $1550-$1600 previous neckline was a guarantee based on technicals.

4. Gold's rise to beyond $2000 was a guarantee now because accumulation was not as small as I had initially anticipated in 2013.

5. Lastly, because Gold's re-accumulation was very massive and very deliberate, an investment target price of $2500-$3000 for Gold investors and Gold ETF investors can be expected.


The Donovan Norfolk Technical Rating:
Bullish short term, mid term and long term.
Gold and Gold ETFs are a buy.


DISCLAIMER

This analysis site, as well as the analyses in it, is created for the sole purpose of education, discussion, fundamental analysis knowledge sharing, technical analysis knowledge sharing, funds flow analysis knowledge sharing, general skills-knowledge sharing and opinions sharing. The contents of this blog are not to be taken as investment advice or inducement to trade, and I take no responsibility for any gains or losses as a result of reading my analyses, judgements and opinions. In essence, practise due diligence. 

Friday, 21 June 2019

Crude Oil (NYMEX/WTI Oil): 21 June 2019, Friday

Crude Oil (NYMEX/WTI Oil):
21 June 2019, Friday
(Click on the Technical Chart Above to Expand)

Attached is the Daily Chart Technicals for Crude Oil.
All analyses and illustrations are as attached on technical chart.
The proper interpretation for crude oil technicals is called 【Inverse Bump-and-Run】. Inverse-Bump-and-Run in technical theory is equivalent to 【Shake-and-Collect】 in technical theory. The first trend line is called the lead-in line. Technicals for Crude Oil is bullish (Strong Accumulation). Crude oil stocks and energy related stocks are bullish biased.

DISCLAIMER
This analysis site, as well as the analyses in it, is created for the sole purpose of education, discussion, fundamental analysis knowledge sharing, technical analysis knowledge sharing, funds flow analysis knowledge sharing, general skills-knowledge sharing and opinions sharing. The contents of this blog are not to be taken as investment advice or inducement to trade, and I take no responsibility for any gains or losses as a result of reading my analyses, judgements and opinions. In essence, practise due diligence. 

Wednesday, 19 June 2019

Apple (NASDAQ: AAPL): 19 June 2019, Wednesday


Apple (NASDAQ: AAPL):
19 June 2019, Wednesday
(Click on the Technical Chart Above to Expand)

Attached is the updated Technicals for Apple.
All analyses and illustrations are as attached on technical chart.
One sentence to summarise the technicals:
Apple will go on to make more historic all time new highs from here.

DISCLAIMER
This analysis site, as well as the analyses in it, is created for the sole purpose of education, discussion, fundamental analysis knowledge sharing, technical analysis knowledge sharing, funds flow analysis knowledge sharing, general skills-knowledge sharing and opinions sharing. The contents of this blog are not to be taken as investment advice or inducement to trade, and I take no responsibility for any gains or losses as a result of reading my analyses, judgements and opinions. In essence, practise due diligence. 

Sunday, 16 June 2019

Hang Seng Index: 16 June 2019, Sunday

Hang Seng Index:
16 June 2019, Sunday
(Click on the Technical Chart Above to Expand)

Attached is the Technicals for Hang Seng Index.
All analyses and illustrations are as attached on technical chart.

DISCLAIMER
This analysis site, as well as the analyses in it, is created for the sole purpose of education, discussion, fundamental analysis knowledge sharing, technical analysis knowledge sharing, funds flow analysis knowledge sharing, general skills-knowledge sharing and opinions sharing. The contents of this blog are not to be taken as investment advice or inducement to trade, and I take no responsibility for any gains or losses as a result of reading my analyses, judgements and opinions. In essence, practise due diligence. 

Friday, 14 June 2019

Gold Daily Chart Technicals: 14 June 2019, Friday


Gold Daily Chart Technicals:
14 June 2019, Friday
(Click on the Technical Chart Above to Expand)

Attached is the Technicals for Gold. Gold (by extension, Gold ETFs as well) has formed a large inverse shoulder head shoulder formation (Inverse SHS). This is a large accumulation below the neckline band in red ($1346.90 to $1364.90). A breakout of this resistance, which it would, will send Gold for immediate target of $1534 per ounce before it will consolidate at the guaranteed target of $1550-$1600. Gold will then make a base at around $1500-$1550 before it will proceed to break up $2000 an ounce again. This move will be in tune with the secular cycle of Gold which I had been preempting. A break above $2000 is also a guaranteed target because the re-accumulation base built over the last 6 years is very large.

The Donovan Norfolk Technical Rating:
Bullish short term, mid term and long term.
Gold and Gold ETFs are a buy.


DISCLAIMER

This analysis site, as well as the analyses in it, is created for the sole purpose of education, discussion, fundamental analysis knowledge sharing, technical analysis knowledge sharing, funds flow analysis knowledge sharing, general skills-knowledge sharing and opinions sharing. The contents of this blog are not to be taken as investment advice or inducement to trade, and I take no responsibility for any gains or losses as a result of reading my analyses, judgements and opinions. In essence, practise due diligence. 

Monday, 10 June 2019

S&P 500 Index: 10 June 2019, Monday


S&P 500 Index:
10 June 2019, Monday
(Click on the Technical Chart Above to Expand)

Attached is the Technicals for the US Market of S&P 500 Index. The S&P 500 Index is in the midst of a large price structure of inverse shoulder-head-shoulder (Inverse SHS). Large inverse shoulder-head-shoulder formations yield large major up waves. The inverse shoulders are being formed symmetrically along the red bands as illustrated. The US Market Economy and US Markets will remain as the strongest in the world completing the upwards sloping inverse-shoulder-head-shoulder. A massive bullishness of upwards sloping inverse SHS formed over a significant time frame as shown means we can expect a large wave of upmove over the next few years.


DISCLAIMER

This analysis site, as well as the analyses in it, is created for the sole purpose of education, discussion, fundamental analysis knowledge sharing, technical analysis knowledge sharing, funds flow analysis knowledge sharing, general skills-knowledge sharing and opinions sharing. The contents of this blog are not to be taken as investment advice or inducement to trade, and I take no responsibility for any gains or losses as a result of reading my analyses, judgements and opinions. In essence, practise due diligence. 

Friday, 7 June 2019

USDCNH (US Dollar Against the Chinese Yuan) Trading Set-up: 7 June 2019, Friday

USDCNH (US Dollar Against the Chinese Yuan):
7 June 2019, Friday
(Click on the Technical Chart Above to Expand)

Attached is the Technicals for USDCNH. Upmove means the Chinese Renminbi (Chinese Yuan) weakening against the Greenback Benchmark. Remember that some time back, before this critical break-up of key resistance, I had forewarned that China Central Bank PBOC will have to implement extreme monetary policy that will send the USDCNH soaring upwards? This is what is happening now: the Chinese Yuan breaking down key intraday supports so that the USDCNH breaks up key intraday resistances. In addition, this USDCNH breakup is on the back of a very large ascending triangle as illustrated. This means the Chinese Yuan depreciation is sustainable even though China maintains that they will keep the Chinese Yuan strong and stable. A very large flood of money tide is going to be released from the world's 2nd largest economy.


DISCLAIMER

This analysis site, as well as the analyses in it, is created for the sole purpose of education, discussion, fundamental analysis knowledge sharing, technical analysis knowledge sharing, funds flow analysis knowledge sharing, general skills-knowledge sharing and opinions sharing. The contents of this blog are not to be taken as investment advice or inducement to trade, and I take no responsibility for any gains or losses as a result of reading my analyses, judgements and opinions. In essence, practise due diligence. 

AUDNZD (Australian Dollar Against the New Zealand Dollar) Technical Set-Up: 7 June 2019, Friday

AUDNZD (Australian Dollar Against the New Zealand Dollar):
7 June 2019, Friday
(Click on the Technical Chart Above to Expand)

Attached is the Technicals for AUDNZD. I have been receiving inquiries like "Can I trade this? Can I trade that?" and that the trade mostly are fixated at Crude Oil, USD, some popular index, stock or commodity/FX. The main idea here is to illustrate that one should not fixate on just popular stuff that everyone is interested in, instead seek to explore many other asset classes or unknown stocks which offer good opportunities. The above is one where when it seemed like there is nothing to trade on, there is always something to trade on.
This is all a matter of mindset -- open new doors, not close doors.


DISCLAIMER

This analysis site, as well as the analyses in it, is created for the sole purpose of education, discussion, fundamental analysis knowledge sharing, technical analysis knowledge sharing, funds flow analysis knowledge sharing, general skills-knowledge sharing and opinions sharing. The contents of this blog are not to be taken as investment advice or inducement to trade, and I take no responsibility for any gains or losses as a result of reading my analyses, judgements and opinions. In essence, practise due diligence. 

Monday, 3 June 2019

Straits Times Index (STI): 3 June 2019, Monday


Straits Times Index (STI):
3 June 2019, Monday
(Click on the Technical Chart Above to Expand)

Attached is the Technicals for Singapore Straits Times Index (STI). STI gives an important glimpse into the state of the world economy. STI has traditionally been the most reliable indicator in measuring true strength of global economy. Most international trade passes through Singapore and it is the 3rd most important financial centre in the world. The STI is currently sitting on trendline support bands in orange and red. This trend band is responsible for maintaining resumption of long term uptrend. In addition, when the STI broke down pink trend line support, it did not engage in backtesting 3073-3171 points as resistance (green horizontal lines and purple horizontal line). Instead, under the guidance of bullish fan structure, it re-captured the 3073-3171 points and backtested these as supports again. We are not in any preparation for worldwide recession as the global media has claimed or warned about. We are in unstoppable bull market worldwide. Price actions speak for itself.


DISCLAIMER

This analysis site, as well as the analyses in it, is created for the sole purpose of education, discussion, fundamental analysis knowledge sharing, technical analysis knowledge sharing, funds flow analysis knowledge sharing, general skills-knowledge sharing and opinions sharing. The contents of this blog are not to be taken as investment advice or inducement to trade, and I take no responsibility for any gains or losses as a result of reading my analyses, judgements and opinions. In essence, practise due diligence. 

Sunday, 2 June 2019

FedEx (NYSE: FDX): 2 June 2019, Sunday


FedEx (NYSE: FDX):
2 June 2019, Sunday
(Click on the Technical Chart Above to Expand)

Attached is the Technicals for FedEx (NYSE: FDX). Fedex would make a natural sacrificial lamb for China to slaughter. This is because after US attempted to knock Huawei into the coma, as part of an overall trade war strategy, China would need to find and gather a few sacrificial lambs that add up to the weight of a Huawei, and to knock these into a KO, if not TKO, as well. If China does not, the message sent would be that China's trade opponent can keep pushing their luck further. Based on logic, FedEx is a natural choice for sending into the operating theatre for China because it will not hurt China much, and it is the 8th largest private employer in the US, and there are easily good substitutes such as DHL and China's very own express postal systems available. FedEx has now ended just below the trendline last Friday, 31 May 2019, essentially confirming a critical breakdown. The market has derived the same forward-looking concept and made the same judgement as me on FedEx now. Expect FedEx to go below $100. After US makes Ericsson and Nokia in Europe the winner, China is making DHL in Europe the winner. More to come. Airbus may become big winners as well. The 2nd Renaissance of Europe is coming, without Europe needing to do anything.


DISCLAIMER

This analysis site, as well as the analyses in it, is created for the sole purpose of education, discussion, fundamental analysis knowledge sharing, technical analysis knowledge sharing, funds flow analysis knowledge sharing, general skills-knowledge sharing and opinions sharing. The contents of this blog are not to be taken as investment advice or inducement to trade, and I take no responsibility for any gains or losses as a result of reading my analyses, judgements and opinions. In essence, practise due diligence. 

Monday, 20 May 2019

Ericsson Telephone Co. (NASDAQ: ERIC): 20 May 2019, Monday


Ericsson Telephone Co. (NASDAQ: ERIC):
20 May 2019, Monday
(Click on the Technical Chart Above to Expand)

Attached is the Technicals for Ericsson Telephone Co. (NASDAQ: ERIC). 
Super Rally is coming for Ericsson, a neutral Swedish company that will be emerging as some of the biggest winners in the Technology war between US and China. Biggest winner from 5G rollout could come from European companies, neutral bloc in between the US and China tussle. Ericsson is currently resuming big strong uptrend from the zone in between the 50MA and 200MA (as support) and from the green classical band of resistance-turned-support as strong powerful support. There is enormous buying pressure here. Even MACD and RSI momentum are turning up for Ericsson. It is in strong buying sweet spot.

Ericsson listed in Europe/Sweden:
20 May 2019, Monday

The 2nd chart is Ericsson's technical price performances in Europe/Sweden. It is also in excellent sweet spot for resumption of strong uptrend.

The Donovan Norfolk Technical Rating:
All 3 Timeframes of Short-Term, Mid-Term & Long -Term are Bullish.
Bullish Buy.

 Funds Flow Analysis
Funds Flow Analysis


DISCLAIMER

This analysis site, as well as the analyses in it, is created for the sole purpose of education, discussion, fundamental analysis knowledge sharing, technical analysis knowledge sharing, funds flow analysis knowledge sharing, general skills-knowledge sharing and opinions sharing. The contents of this blog are not to be taken as investment advice or inducement to trade, and I take no responsibility for any gains or losses as a result of reading my analyses, judgements and opinions. In essence, practise due diligence. 

Friday, 17 May 2019

Crude Oil (WTI Oil): 17 May 2019, Friday, 7.11pm Singapore Time

Crude Oil (WTI Oil): 
17 May 2019, Friday, 7.11pm Singapore Time

Attached is the Technicals of Crude Oil (WTI Oil) which has moved according to my forewarned directions as explained in my previous analyses and Facebook Tweets. All my followers are in the green now. Crude Oil Stocks take heed of directions from the Crude Oil Primary Sources Market. Things to take note: 1. Bull's Fan (Perfect Technicals); 2. Bullish Rounding Bottom achieved in the intra-days; 3. Worldwide Smart Monies had been bullish in the Crude Oil market as highlighted the past 6 months when it was below $60 and to add icing to the cake, the market-makers were joining the large longs as taught in funds flow theoretical models and calculations. When big monies are not obstructed by market-makers, extraordinary events happen. Crude oil stocks are bullish biased -- to the exent even Warren Buffett is scooping crude oil stocks cheaply now. He knows his stuff.

 Funds Flow Analysis
Funds Flow Analysis


DISCLAIMER

This analysis site, as well as the analyses in it, is created for the sole purpose of education, discussion, fundamental analysis knowledge sharing, technical analysis knowledge sharing, funds flow analysis knowledge sharing, general skills-knowledge sharing and opinions sharing. The contents of this blog are not to be taken as investment advice or inducement to trade, and I take no responsibility for any gains or losses as a result of reading my analyses, judgements and opinions. In essence, practise due diligence. 

USDCNH: 17 May 2019, Friday, 6.20pm Singapore Time

USDCNH: 
17 May 2019, Friday, 6.20pm Singapore Time

Attached is the Technicals of USDCNH (USD against Chinese Yuan) which has moved according to my forewarned directions as explained in my Facebook Tweets. All my followers are in the green now. The USDCNH has negated all built-up bearish divergences. This is very bullish in nature. The trendline in black has been reinforced to become a strong trend. Every time when the black trendline uptrend is being maintained and green classical resistances are being broken upwards, a major move happens. China continues flooding Chinese Yuan into the markets, making it the best trade, or even best investment, to be shorting the Chinese Yuan right now. Chinese Central Bank, the PBOC, offers the big brother protection as analysed earlier in my Facebook Page Posts.

 Funds Flow Analysis
Funds Flow Analysis


DISCLAIMER

This analysis site, as well as the analyses in it, is created for the sole purpose of education, discussion, fundamental analysis knowledge sharing, technical analysis knowledge sharing, funds flow analysis knowledge sharing, general skills-knowledge sharing and opinions sharing. The contents of this blog are not to be taken as investment advice or inducement to trade, and I take no responsibility for any gains or losses as a result of reading my analyses, judgements and opinions. In essence, practise due diligence. 

Tuesday, 7 May 2019

Hang Seng Index & Dow Jones Industrial Index as Reflection of Worldwide Markets: 7 May 2019, Tuesday, 1.33am Singapore Time

Hang Seng Index & Dow Jones Industrial Index as Reflection of Worldwide Markets:
7 May 2019, Tuesday, 1.33am Singapore Time
(Click on the Technical Chart Above to Expand)

Attached above is the Technicals for Hong Kong Hang Seng Index reflecting price actions at the Chinese side. The First Brown Circled Region is where the backtest guarantees that Hang Seng Index will hit a Price Target at 45,000 points to 50,000 points. In contrary to the herd's logic, the US Trade War actually secures Bull Market Confirmations -- this is a technical concept that goes against the logic of the herd (refer to technical chart above to fully understand the real macro picture). Major negotiations and re-negotiations between China and the US are not to be viewed bearishly.

Hang Seng Index Target is 45000-50000 points (refer to chart technicals of 20000 points upside) after this round of fearful backtest of support as illustrated.

Hang Seng Index & Dow Jones Industrial Index as Reflection of Worldwide Markets:
7 May 2019, Tuesday, 1.33am Singapore Time
(Click on the Technical Chart Above to Expand)

Now on the US side, the Dow Jones Industrial had 4 previous extraordinarily high volumes. To the layman, they would had thought that these were selling volumes. If you had mastered the concept of the Super Root of All Funds Flow and combined it with the volumes as above, all 4 volumes above are high RED volumes of absorption and high Green volumes of deliberated buying from the sell queues of the herd done by smart monies worldwide (using fear). There is a reason why Warren Buffett continues buying the markets, including crude oil stocks such as Occidental Petroleum. The markets' upside remain huge as illustrated by the HSI as an example. US markets are much stronger than Chinese and HK markets. As for DJIA, it will backtest the double-black band of resistance-turned-supports which had already been broken out upwards, following which it would make confirmation as illustrated on technical chart, and proceed to make all time new highs upon the backtest. This would be IN SYNC WITH THE SUPER ROOT OF ALL FUNDS FLOW THAT GUARANTEES NO BEAR MARKET, ONLY MORE NON-STOPPING HISTORICAL NEW HIGHS TO COME. 

 Funds Flow Analysis
Funds Flow Analysis


DISCLAIMER

This analysis site, as well as the analyses in it, is created for the sole purpose of education, discussion, fundamental analysis knowledge sharing, technical analysis knowledge sharing, funds flow analysis knowledge sharing, general skills-knowledge sharing and opinions sharing. The contents of this blog are not to be taken as investment advice or inducement to trade, and I take no responsibility for any gains or losses as a result of reading my analyses, judgements and opinions. In essence, practise due diligence. 

Monday, 6 May 2019

Summit Wireless Technologies (NASDAQ: WISA): 6 May 2019, Monday

Summit Wireless Technologies (NASDAQ: WISA):
6 May 2019, Monday
(Click on the Technical Chart Above to Expand)

Attached is the Technicals for Summit Wireless Technologies (NASDAQ: WISA). The orange series of volume flow shows where Automated Algos had been using extremely low volumes to accumulate at large-spread buy queues; once market volumes come in soon (refer to breakup zone and backtest zone in green), algos will have no choice but to squeeze the spread and follow the buying spree up for the stock. It is currently undervalued.


 Funds Flow Analysis
Funds Flow Analysis


DISCLAIMER

This analysis site, as well as the analyses in it, is created for the sole purpose of education, discussion, fundamental analysis knowledge sharing, technical analysis knowledge sharing, funds flow analysis knowledge sharing, general skills-knowledge sharing and opinions sharing. The contents of this blog are not to be taken as investment advice or inducement to trade, and I take no responsibility for any gains or losses as a result of reading my analyses, judgements and opinions. In essence, practise due diligence. 

Wednesday, 24 April 2019

DJIA, S&P 500 and NASDAQ: 24 April 2019, Wednesday

DJIA, S&P 500 and NASDAQ:
24 April 2019, Wednesday
(Click on the Technical Chart Above to Expand)

Attached is the Technicals for DJIA, S&P 500 and NASDAQ. The Green Circled Regions are my live fore-warnings back in Dec-2018 and Jan-2019, cautioning that the Smart Monies' Root of All Funds Flow In This World guarantees that there will be no bear market, and that the chance of bear market is a zero percent, when fear was extremely rampant back then.

In April 2019, DJIA has now risen more than 5000 points per contract ($10 per point) since my live fore-warnings, and the S&P 500 and NASDAQ have both broken all time new highs againtrue to my words. The secular bull market (20-25 years) is still only at HALFWAY MARK, with majority of the gains for stocks across the board to come in 2nd half of the bull market.

If you had learnt funds flow analysis, you will know how to read and interpret big data, how markets truly operate, and learnt how to do well.


 Funds Flow Analysis
Funds Flow Analysis


DISCLAIMER

This analysis site, as well as the analyses in it, is created for the sole purpose of education, discussion, fundamental analysis knowledge sharing, technical analysis knowledge sharing, funds flow analysis knowledge sharing, general skills-knowledge sharing and opinions sharing. The contents of this blog are not to be taken as investment advice or inducement to trade, and I take no responsibility for any gains or losses as a result of reading my analyses, judgements and opinions. In essence, practise due diligence. 

Wednesday, 17 April 2019

Development Bank of Singapore (DBS): 17 April 2019, Wednesday

Development Bank of Singapore (DBS):
17 April 2019, Wednesday
(Click on the Technical Chart Above to Expand)

Attached is the Intraday Technicals of Development Bank of Singapore (DBS) that is listed in Singapore. It is the Donovan Norfolk Top Rated Stock of Singapore. The 2 Black Boxed Region is the Donovan Norfolk Live Warnings during Nov-Dec 2018 and Jan 2019 to buy the golden dip. During end-2018 and early 2019, I had forewarned that this would be the final chance to buy cheaply if one had failed to catch the 2016 bottom with me at $14.00-$17.00. During the maximum fear in end-2018 and early-2019, I had also guaranteed that there would be no bear market based on the Super Root of All Funds Flow. The grasp of the concept of the Root of Funds Flow separates the novices from the professionals. Study the intraday chart technicals for more in depth reading of the chart.


 Funds Flow Analysis
Funds Flow Analysis


DISCLAIMER

This analysis site, as well as the analyses in it, is created for the sole purpose of education, discussion, fundamental analysis knowledge sharing, technical analysis knowledge sharing, funds flow analysis knowledge sharing, general skills-knowledge sharing and opinions sharing. The contents of this blog are not to be taken as investment advice or inducement to trade, and I take no responsibility for any gains or losses as a result of reading my analyses, judgements and opinions. In essence, practise due diligence.