Ticker 1

Ticker 2

Click "Like" to Receive First Hand Updates From The Analysis Site / Click "SHARE" to share

Wednesday, 7 September 2016

REX International: 7 September 2016, Wednesday, 6.05am Singapore Time

REX International Chart 1: 
7 September 2016, Wednesday, 6.05am Singapore Time

Attached above is the technicals of REX International, a stock that is listed in the SGX Singapore Market. The entire series of volume analysis, including the low volume selling and high volume buying, is as illustrated on chart. Huge bullish descending wedge of re-accumulation is being done on REX International, a sign of a bottom as well as a sign of big moves up to come in 2H-2016 and 2017.

REX International Chart 2: 
7 September 2016, Wednesday, 6.05am Singapore Time

Chart 2 above shows the major support in price actions in green.
REX International will participate in the worldwide stock market rally.

Note:
【Worldwide stock markets to have super rally in 2H-2016 and 2017.】


IRIS Technical Analysis: 7 September 2016, Wednesday, 5.37am Singapore Time

IRIS Technical Analysis: 
7 September 2016, Wednesday, 5.37am Singapore Time

Attached above is the technicals of IRIS, a stock that is listed in the KLSE Market. The technical break ups of the long term PINK trend lines and short term LIGHT-PURPLE classical resistance lines, the volume analysis, and the declaration of smart monies' attack-up intention, are all as illustrated on chart. 0.144 to 0.153 classical band of support as highlighted on chart will form the base to launch a powerful rally in this stock for the rest of 2016 and 2017. IRIS is a stock which wants to charge up. Strong bull and more up moves to come.

DNA Technical Rating:
Bullish
【Worldwide stock markets to have super rally in 2H-2016 and 2017.】


Tuesday, 6 September 2016

Noble Group Technical Analysis: 6 September 2016, Tuesday, 8.47am Singapore Time

Noble Group Technical Analysis Chart 1: 
6 September 2016, Tuesday, 8.47am Singapore Time

Attached above is the technicals of Noble Group, a stock that is listed in the SGX Singapore Market. The entire series of volume analysis, including the triple low volume selling and high volume buying, is as illustrated on chart. This is a sign of buying taking over now. A sign of a bottom.

Noble Group Technical Analysis Chart 2: 
6 September 2016, Tuesday, 8.47am Singapore Time

Chart 2 above shows the major support in PINK.
Noble will participate in the worldwide stock market rally.

Note:
【Worldwide stock markets to have super rally in 2H-2016 and 2017.】


Crude Oil Technical Analysis: 6 September 2016, Tuesday, 8.14am Singapore Time

Crude Oil Technical Analysis: 
6 September 2016, Tuesday, 8.14am Singapore Time

Attached above is the technicals for crude oil:
* Crude Oil has bottomed
* Bullish Wedge (Significant and large)
* Bullish Wedge has broken up
* Reversal for the upside has taken place
* Added more Buys.
* Minor support has been formed at $40.00 and $45.00. More and more minor supports and major supports will be formed to launch more upmove beyond $50.00 and beyond $60.00.


VIVOCOM Technical Analysis: 6 September 2016, Tuesday, 1.03am Singapore Time

VIVOCOM Technical Analysis: 
6 September 2016, Tuesday, 1.03am Singapore Time

Attached above is the technicals of VIVOCOM, a stock that is listed in the KLSE Market. The entire series of volume analysis, including the declaration of smart monies' attack-up intention, is as illustrated on chart. 0.21 to 0.23 classical band of support as highlighted on chart will form the base to launch a powerful rally in this stock for the rest of 2016 and 2017. VIVOCOM is an angry bull which wants to charge up. It accepts nothing but up. Strong bull and more upmoves to come.

DNA Technical Rating:
Bullish
【Worldwide stock markets to have super rally in 2H-2016 and 2017.】


Thai Beverage Technical Analysis: 6 September 2016, Tuesday, 12.42am Singapore Time

Thai Beverage Technical Analysis:
6 September 2016, Tuesday, 12.42am Singapore Time

Attached above is the technicals of Thai Beverage, a stock that is listed in the SGX Singapore Market. The entire series of volume analysis, including the declaration of smart monies' attack-up intention, is as illustrated on chart. 76cents and 82.5cents as highlighted on chart will form the base to launch a first liner rally in this stock for the rest of 2016 and 2017. Thai Beverage will belong to the first liner stock for super rally. It is an angry bull which wants nothing but up. Strong bull and more upmoves to come.

DNA Technical Rating:
Bullish
【Worldwide stock markets to have super rally in 2H-2016 and 2017.】


Yangzijiang Technical Analysis: 6 September 2016, Tuesday, 12.35am Singapore Time

Yangzijiang Technical Analysis: 
6 September 2016, Tuesday, 12.35am Singapore Time

Attached above is the technicals of Yangzijiang, a stock that is listed in the SGX Singapore Market. 
The shorting zone and the No Shorts Zone is as illustrated on chart. Yangzijiang is currently on the No Shorts Zone where the downside is limited and rebound-upside from the support band is high. 
Instead of shorting markets, one should be looking to buy markets on dip for the rest of 2016 and 2017.

Current Price for Buying:
$0.765
(You should be bullish for 2H-2016 and buying, because most people are bearish and see only gloom ahead. Most people are bearish because they base their decision naively on current news and the already established facts. Markets do not work this way. Markets are forward-pricing.)

LionGold Technical Analysis: 6 September 2016, Tuesday, 12.20am Singapore Time

LionGold Technical Analysis: 
6 September 2016, Tuesday, 12.20am Singapore Time

Attached above is the technicals for LionGold that is listed in the SGX Singapore Market.
The Black circled regions are my past analyses in 2013, 2014 and early 2015 to get out of stock markets. The Green boxed region is my latest analysis in 2016 analysing that LionGold has finally bottomed with Capitulation. 

LionGold Technical Analysis: 
6 September 2016, Tuesday, 12.20am Singapore Time

In standard textbook style technical theories, red volume bars are sell volumes; however, applying blindly, most people will be fooled most of the time. The above red volume bars on chart are red volume bars of buying (re-accumulation). LionGold has bottomed.


Monday, 5 September 2016

Jumbo Technical Analysis: 5 September 2016, Monday, 11.41pm Singapore Time

Jumbo Technical Analysis: 
5 September 2016, Monday, 11.41pm Singapore Time

Attached above is the technicals for Jumbo, a stock that is listed in the SGX Singapore Market.
Jumbo is exhibiting a healthy volume flow as illustrated on chart. It is a strong uptrend stock. This means this would belong to the front liners to rally together with global stock market rally for the rest of 2016 and whole of 2017. This kind of stock is pretty ideal for both traders and investors.

DNA Technical Rating:
Bullish
【Worldwide stock markets to have super rally in 2H-2016 and 2017.】

InnoPac Technical Analysis: 5 September 2016, Monday, 9.08am Singapore Time

InnoPac Technical Analysis: 
5 September 2016, Monday, 9.08am Singapore Time

Attached above is the technicals for InnoPac. The orange regions are my past live warnings to get out of the market amidst bullish public sentiments. The green region is my current live warning that markets are preparing for a major rally amidst bearishness in public sentiments in 2016. The red curve illustrates how selling is dry now and the green region is also where stealth buying is taking over now in the markets.


Friday, 2 September 2016

Yanlord Land Technical Analysis: 2 September 2016, Friday, 2.59pm Singapore Time

Yanlord Land Technical Analysis: 
2 September 2016, Friday, 2.59pm Singapore Time

Attached above is the technicals for Yanlord Land that is listed in the SGX Singapore Stocks Market.
All advanced volume flows are as indicated on the above attached chart.
There will be a very powerful technical break-up in 2H-2016 and 2017 which will see prices of Yanlord Land go soaring. Public sentiment is currently bearish in financial markets, expecting a stock market crash and a bear market due to the brainwash by the media. On the contrary, financial markets worldwide will once again fool most people most of the time with a super rally this time.


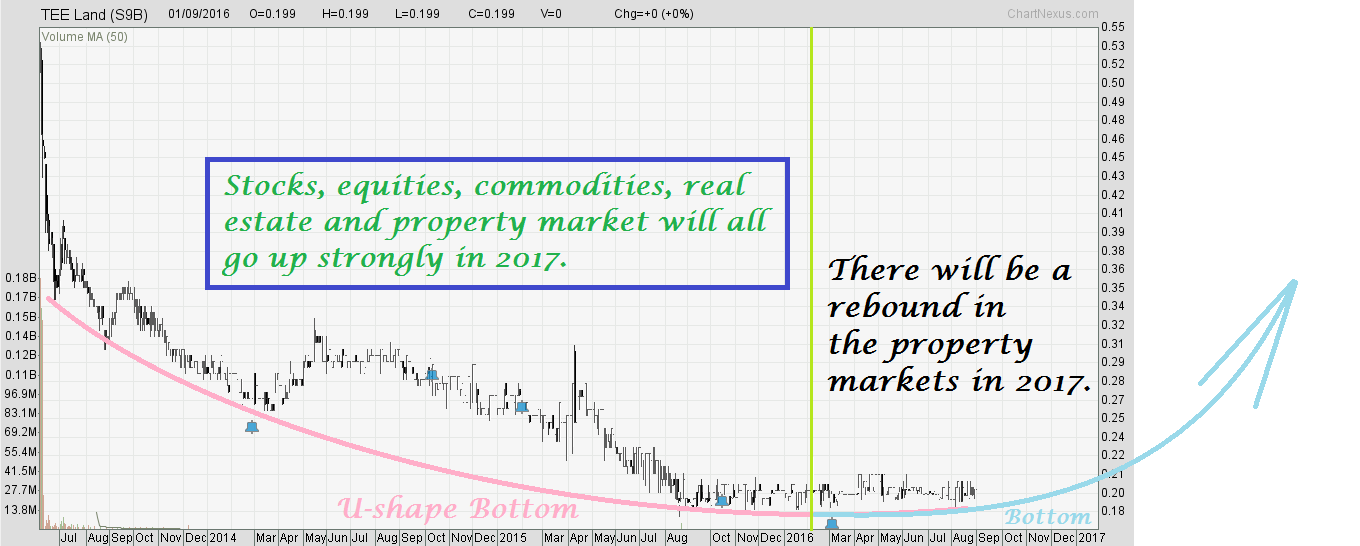
Tee Land Technical Analysis: 2 September 2016, Friday, 2.32pm Singapore Time

Tee Land Technical Analysis: 
2 September 2016, Friday, 2.32pm Singapore Time

Attached above is the Technicals for Tee Land that is listed in the SGX Singapore Stocks Market.
This stock is doing a U-shaped bottom right now. The bottom will end soon. There will be a rebound in the property markets in 2017. Stocks, equities, commodities, real estate and property markets will all go up in 2017.


Thursday, 1 September 2016

YTL Technical Analysis: 1 September 2016, Thursday, 8.25pm Singapore Time

YTL Technical Analysis: 
1 September 2016, Thursday, 8.25pm Singapore Time

Attached above is the technicals for YTL that is listed in the KLSE.
After going into a big wave correction and consolidation the past 2 years, YTL is getting ready to fly up again based on current technicals as illustrated on chart.
Declarations of upmove intentions by smart monies are as highlighted on chart.
YTL is ready for flying up again.
YTL will continue to rally for the rest of 2016 as well as for 2017. 


SingMedical Technical Analysis: 1 September 2016, Thursday, 12.05am Singapore Time

SingMedical Technical Analysis: 
1 September 2016, Thursday, 12.05am Singapore Time

Zika Theme: Attached above is the technicals for SingMedical that is listed in the SGX Singapore Stocks Exchange.
High volume buying forming the flag pole is accompanied by relative low volume selling forming the bullish flag. Flag pole is a conservative 20cents. Price will move up 20cents from the flag breakup point. Potential upside: an impulsive +66%


Wednesday, 31 August 2016

MYEG Technical Analysis: 31 August 2016, Wednesday, 11.33pm Singapore Time

MYEG Technical Analysis: 
31 August 2016, Wednesday, 11.33pm Singapore Time

Attached above is the technicals for MYEG that is listed in the KLSE.
It is a long term uptrend stock that has finished its mid-long term correction now. It is ready for flying again based on current technicals.
MYEG will continue to rally for the rest of 2016 as well as for 2017.

Based on large flagpole-flag-flagpole projection, take profits once above $3.00 region (around +50% profits).


Fu Yu Technical Analysis: 31 August 2016, Wednesday, 11.36am Singapore Time

Fu Yu Technical Analysis: 
31 August 2016, Wednesday, 11.36am Singapore Time

Attached above is the technicals for Fu Yu, a stock that is listed in the SGX Singapore Stocks Exchange.

The Full Volume Flow that has been traded and executed in this stock is as fully illustrated and explained in the chart itself. Buying up has been impulsive with high volume; selling has been at times impulsive and sometimes corrective but whatever the selling, it has always been of relative low volume selling and dries up fast.

The Orange Regions are regions of huge absorption where the stock has been sucked into the strong hands in the market (MARKET ABSORPTION). Suction and absorption by strong hands almost always result in big waves up. On technical terms, together with worldwide funds flow of big longs as background, the tide will push this boat up strongly. Bullish.


Tuesday, 30 August 2016

Nickel Asia Corporation Technical Analysis: 30 August 2016, Tuesday, 9.15pm Singapore Time

Nickel Asia Corporation Chart 1: 
30 August 2016, Tuesday, 9.15pm Singapore Time

Attached above is the Technicals for Nickel Asia Corporation that is listed in Philippines PSE Stocks Exchange.
In consistency with my previous bullish conclusion for metals, for this stock, all the series of low volume selling (disinterest in any selling) and high volume buying (high interest by smart monies in getting this stock) are as illustrated on chart: big hands and smart monies are into this stock based on the volume flow. Multi-fold up move for Nickel Asia Corporation is coming because the calculated current holdings held by big hands based on volume flow as above are big.

Nickel Asia Corporation Chart 2: 
30 August 2016, Tuesday, 9.15pm Singapore Time

Nickel Asia Corporation Chart 2 above illustrates the entire bottoming process.

DNA Technical Rating on Nickel Asia Corporation:
HIGHLY BULLISH

Coastal (KLSE: 5071) Technical Analysis: 30 August 2016, Tuesday, 11.35am Singapore Time

Coastal (KLSE: 5071) Technical Analysis: 
30 August 2016, Tuesday, 11.35am Singapore Time

Below was a question that was posted to me and it was kinda good question: 
"Does KLSE: BONOIL chart analysis (extension also to SGX: GeoEnergy and PSE: Philex Petroleum Corp and NYSE: Phillips-66) apply to all counters? And I'm wondering if those oil related stocks that have low volume trading, how chart analysis applies to those stocks then? (Eg: Coastal contracts klse.5071) Thanks."

My answer:
 When we do analysis, it often has to be industry-wide phenomenon first before zooming laterally to inter-industry and zooming vertically to individual stocks and individual companies of the industry in focus. Top-down approach as preference. Although outliers do exist, however outliers are often rare and few. A tide or a wave moves almost all boats. The chart above answers the question as well for low volume 3rd liners. 3rd liners will usually rally after 2nd liners do and 2nd liners rally after 1st liner big caps do. Hence, the bottoming for 3rd liners will often be a wider time frame, bigger mouth U-shape (refer to Coastal Technicals as above). Cross reference to first liners such as Phillips-66 (http://donovan-ang.blogspot.sg/2016/07/phillips-66-technical-analysis-28-july.html) that is listed in New York Stocks Exchange (NYSE: PSX), while the first liners prepare to break up, the 3rd liners are bottoming as like Coastal (KLSE: 5071). Intra-national and inter-national, the mechanism is the same.


Technical Analysis of CHFJPY For Your Learning: 30 August 2016, Tuesday, 10.10am Singapore Time

Technical Analysis of CHFJPY For Your Learning: 
30 August 2016, Tuesday, 10.10am Singapore Time

Attached above is the CHFJPY Technical Analysis for your learning.
Refer to the previous live analysis as below when the trade was taken:
http://donovan-ang.blogspot.sg/2016/06/chfjpy-technical-analysis-24-jun-2016_24.html

On 24th June 2016 (Singapore Time), while the Brexit vote was being counted, I said:"While Brexit vote-counting is on-going, CHFJPY has one of the best price structures for trading in place of GBP-pairs. Best opportunities are not at the warzone areas of GBP anymore. CHFJPY: Short (Bearish)"

I am exiting and taking profits of 1st batch of the CHFJPY shorts now, in consistency with my bullishness on Japanese Nikkei-225.
Technicals are as illustrated on chart.

Above are the profits in (¥) Japanese Yen (JPY).
Below are the profits converted into (SD) Singapore Dollar (SGD).


Profits in this mid term trade:
+ S$ 135,378 SGD

Cumulative:
S$ 1,632,519 + S$ 135,378
= + S$ 1,767,897 SGD

Trading Journal:


CADJPY Technicals: 30 August 2016, Tuesday, 9.40am Singapore Time

CADJPY Technicals: 
30 August 2016, Tuesday, 9.40am Singapore Time

Bought some CADJPY for investment.
Technicals as illustrated on attached chart above.


Geo Energy Resources Technical Analysis: 30 August 2016, Tuesday, 9.03am Singapore Time

Geo Energy Resources Technical Analysis: 
30 August 2016, Tuesday, 9.03am Singapore Time

Attached is the technicals for Geo Energy Resources that is listed in the SGX Singapore Stock Market.
The strong buy-up interest in the volumes and the disinterest in selling from the volumes in this stock means that this stock has a lot more legs to go up and is warming up and re-starting an entirely new wave of up-move. This is even especially true because 2H-2016 and 2017 will see stock markets having super rally worldwide. Smart Monies' Re-accumulation Zone of crude oil related and energy related stocks is as highlighted in YELLOW ZONE in technical chart attached. Bullish. Rally is coming.

Side-note:
Malaysia, Philippines, Singapore, US oil related stocks are all having smart money buy intentions. 


BORNOIL Technical Analysis: 30 August 2016, Tuesday, 8.37am Singapore Time

BORNOIL Technical Analysis: 
30 August 2016, Tuesday, 8.37am Singapore Time

Attached is the technicals for BORNOIL that is listed in the KLSE Malaysian Stock Market.
The strong buy-up interest in the volumes and the disinterest in selling from the volumes in this stock means that this stock has a lot more legs to go up and is warming up and re-starting an entirely new wave of up-move. This is even especially true because 2H-2016 and 2017 will see stock markets having super rally worldwide. Bullish. Smart Monies' declaration that this oil related stock will break up 0.212 is as illustrated in chart. Lucrative up-move is coming.

Side-Note:
Malaysia, Philippines, Singapore, US oil related stocks are all having smart money buy intentions in 2H-2016.

Philex Petroleum Corp Technical Analysis: 30 August 2016, Tuesday, 8.23am Singapore Time


Philex Petroleum Corp Technical Analysis: 
30 August 2016, Tuesday, 8.23am Singapore Time

Attached is the technicals for Philex Petroleum Corp that is listed in the PSE Philippines Stock Market.
The strong buy-up interest in the volumes and the disinterest in selling from the volumes in this stock means that this stock has some more legs to go up. This is even especially true because 2H-2016 and 2017 will see stock market super rally worldwide.
Bullish.

Side-note:
Malaysia, Philippines, Singapore, US oil related stocks are all having smart money buy intentions in 2H-2016. Refer to all previous technical charts.