Ticker 1

Ticker 2

Click "Like" to Receive First Hand Updates From The Analysis Site / Click "SHARE" to share

Friday, 18 December 2015

Funds Flow Analysis (FFA): 18 December 2015, Friday, 8.05pm Singapore Time


Current Latest Computed Funds Flow Analysis (FFA):
For Worldwide Financial Markets:
18 December 2015, Friday, 8.05pm Singapore Time
Donovan Norfolk Ang Funds Flow Analysis Indicator 
for Worldwide Financial Markets 
18 December 2015, Friday

Broad Markets / Big Markets / Big Wind Directions

US markets (DJIA. S&P500 and NASDAQ) are 02 hours 25 minutes away from opening for trading while European markets are in the first 04 hours 05 minutes of trading.

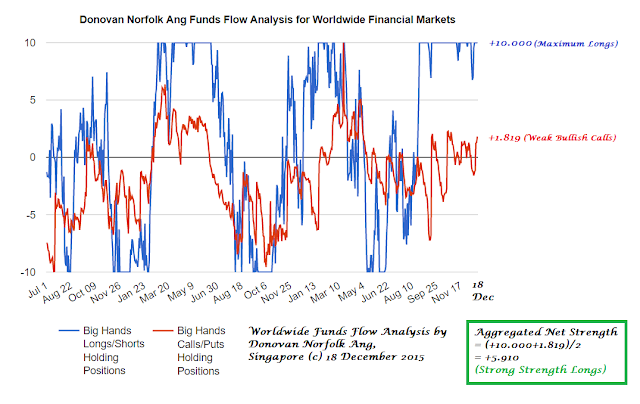
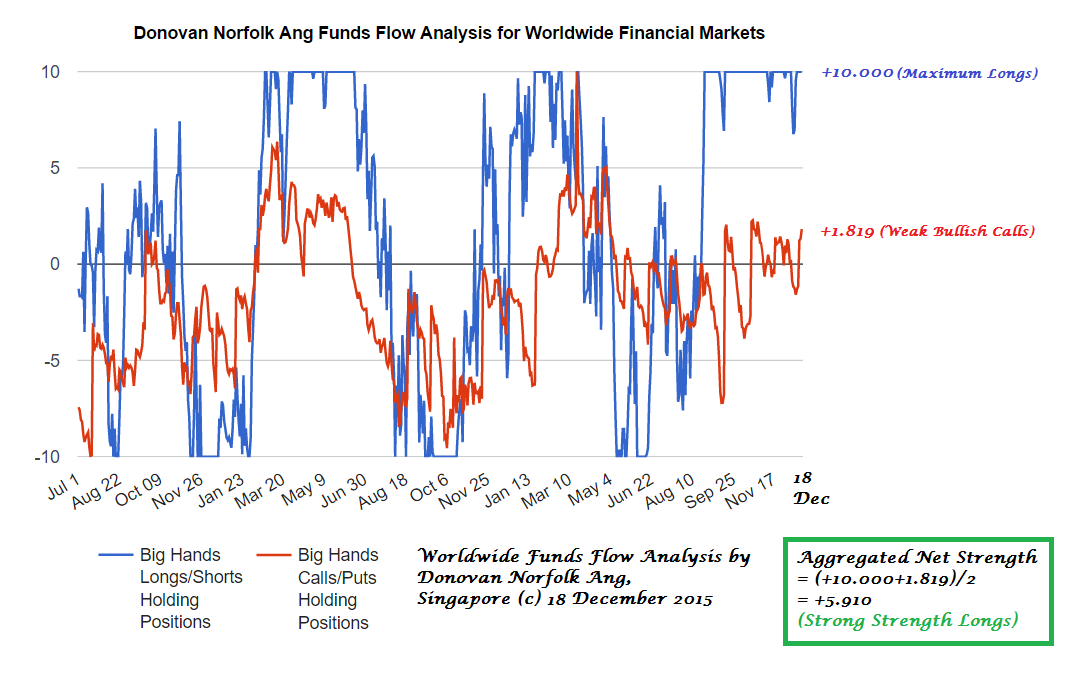
Based on current latest computational results, Holdings Index Strength of Big Monies have changed from +10.000 (Maximum Strength Longs) to +10.000 (Maximum Strength Longs) in strength on the Donovan Norfolk Funds Flow Index Oscillator. On the other front, Smart Monies' Bullish Calls Holdings on hand changed from +1.320 to +1.819 in strength on the Donovan Norfolk Funds Flow Index Oscillator.  

Big Money Aggregated Strength (posture) in holdings changed from +5.660 to +5.910 in strength (Smart Monies are Strong Strength Longs in Aggregated Holdings currently)


Broad Market (Big Wind Direction) Short-Term / Mid-Term Posture by Big Hands:

In the financial markets worldwide today:

+ Smart monies are consolidating their longs positions on hand.
+ Smart Monies maintain MAXIMUM LONGS STRENGTH IN HOLDINGS.
+ Smart monies added Bullish Calls today.
+ Big Hands worldwide are consolidating their longs positions, while shaking out weak retailers.
+ Note that Smart Monies pushed down worldwide markets on 14th December and 15th December, but added longs during the suppression of the worldwide markets.

+ Retailers were shorting and dumping on fear, while smart monies were scooping up and buying the markets on fear during 14th and 15th December, before FED released rate hike announcement.
+ Smart monies are dual longs in holding strength: Bullish Bias.
+ Short-Mid Term: Uptrend.


Worldwide financial markets are executing the following basic technical structures:

+ Long term: Transition to Bear Markets (Last wave up)
+ Mid term: Uptrend
+ Short term: Uptrend

The order of how individual stocks will transit into their individual bear markets respectively

While Long Term Major Top starts to form in indices worldwide, the following is the order of how individual stocks will transit into their individual bear market respectively:

1. Weakest stocks (2.27% of the entire broad market) will start to transit into their bear markets in 2012, making it 2.27% of the entire broad markets in bear market (market indices to still make highs). 

2. Weaker stocks (the next 13.59% of the broad market) will start to transit into their bear markets in 2013, making it 2.27%+13.59%=15.86% of the entire broad markets in bear market (market indices to still make new highs but with deceleration). 

3. Weak stocks (the next 34.13% of the broad market) will start to transit into their bear markets in 2014, making it 15.86%+34.13%=49.99% of the entire broad markets in bear market (market indices to consolidate and to peak out)

4. Strong stocks (the next 34.13% of the broad market) will start to transit into their bear markets in 2015, making it 49.99%+34.13%=84.12% of the entire broad markets in bear market (market indices to start to go downtrend)

5. The stronger and the strongest stocks (the remaining 15.88% of the broad market) will transit into their bear markets in 2016 onwards, making it 84.12%+15.88%=100% of the entire broad markets in bear market (market indices in bear market).

-----------------------------------------------------------------------------------------------------------------
Donovan Big Money Funds Flow Computational Oscillator
-----------------------------------------------------------------------------------------------------------------

Donovan's Funds Flow Analysis Index Oscillator:
-10 ----- 0 ------+10
Donovan's Funds Flow Analysis Strength-Index Scale Key:
negative (-ve) = shorting;
positive (+ve) = longing;
0.000-0.999: Neutral / Negligible Net Holdings
1.000-2.999: Weak strength / weak holdings
3.000-4.999: Moderate strength / moderate holdings
5.000-6.999: Strong strength / high holdings
7.000-8.999:Very strong strength / very high holdings
9.000-10.000:: Maximum strength / maximum holdings

Implication of Broad Markets/Big Markets/Big Wind Indices Directions
If it is a rising tide in Index Big Wind, most or almost all stock boats generally rise;
If it is a receding tide in Index Big Wind, most or almost all stock boats generally go lower.
Hence the importance of Big Wind Directions blown by Big Hands.


Click "Share" on the Facebook icon at the bottom of this thread if you like it, or 
if you would like to start a discussion about it with friends on your Facebook Wall.

Thursday, 17 December 2015

Funds Flow Analysis (FFA): 17 December 2015, Thursday, 9.58pm Singapore Time


Current Latest Computed Funds Flow Analysis (FFA):
For Worldwide Financial Markets:
17 December 2015, Thursday, 9.58pm Singapore Time

Donovan Norfolk Ang Funds Flow Analysis Indicator 
for Worldwide Financial Markets 
17 December 2015, Thursday

Broad Markets / Big Markets / Big Wind Directions

US markets (DJIA. S&P500 and NASDAQ) are 00 hour 32 minutes away from opening for trading while European markets are in the first 05 hours 58 minutes of trading.

Based on current latest computational results, Holdings Index Strength of Big Monies have changed from +10.000 (Maximum Strength Longs) to +10.000 (Maximum Strength Longs) in strength on the Donovan Norfolk Funds Flow Index Oscillator. On the other front, Big Monies flipped from Bearish Puts to Bullish Calls, with strength changed from +1.230 to +1.320 in strength on the Donovan Norfolk Funds Flow Index Oscillator.  

Big Money Aggregated Strength (posture) in holdings changed from +5.615 to +5.660 in strength (Smart Monies are Strong Strength Longs in Aggregated Holdings currently)


Broad Market (Big Wind Direction) Short-Term / Mid-Term Posture by Big Hands:

In the financial markets worldwide today:

+ Note that Smart Monies pushed down worldwide markets on 14th December and 15th December, but added longs during the suppression of the markets.
+ Retailers were shorting and dumping on fear, while smart monies were scooping up and buying the markets on fear during 14th and 15th December, before FED released rate hike announcement.
+ Smart monies maintains MAXIMUM LONGS STRENGTH IN HOLDINGS.
+ Smart monies added Bullish Calls today.
+ Smart monies are dual longs in holding strength: Bullish Bias.
+ Short-Mid Term Uptrend.


Worldwide financial markets are executing the following basic technical structures:

+ Long term: Transition to Bear Markets
+ Mid term: Uptrend
+ Short term: Uptrend

The order of how individual stocks will transit into their individual bear markets respectively

While Long Term Major Top starts to form in indices worldwide, the following is the order of how individual stocks will transit into their individual bear market respectively:

1. Weakest stocks (2.27% of the entire broad market) will start to transit into their bear markets in 2012, making it 2.27% of the entire broad markets in bear market (market indices to still make highs). 

2. Weaker stocks (the next 13.59% of the broad market) will start to transit into their bear markets in 2013, making it 2.27%+13.59%=15.86% of the entire broad markets in bear market (market indices to still make new highs but with deceleration). 

3. Weak stocks (the next 34.13% of the broad market) will start to transit into their bear markets in 2014, making it 15.86%+34.13%=49.99% of the entire broad markets in bear market (market indices to consolidate and to peak out)

4. Strong stocks (the next 34.13% of the broad market) will start to transit into their bear markets in 2015, making it 49.99%+34.13%=84.12% of the entire broad markets in bear market (market indices to start to go downtrend)

5. The stronger and the strongest stocks (the remaining 15.88% of the broad market) will transit into their bear markets in 2016 onwards, making it 84.12%+15.88%=100% of the entire broad markets in bear market (market indices in bear market).

-----------------------------------------------------------------------------------------------------------------
Donovan Big Money Funds Flow Computational Oscillator
-----------------------------------------------------------------------------------------------------------------

Donovan's Funds Flow Analysis Index Oscillator:
-10 ----- 0 ------+10
Donovan's Funds Flow Analysis Strength-Index Scale Key:
negative (-ve) = shorting;
positive (+ve) = longing;
0.000-0.999: Neutral / Negligible Net Holdings
1.000-2.999: Weak strength / weak holdings
3.000-4.999: Moderate strength / moderate holdings
5.000-6.999: Strong strength / high holdings
7.000-8.999:Very strong strength / very high holdings
9.000-10.000:: Maximum strength / maximum holdings

Implication of Broad Markets/Big Markets/Big Wind Indices Directions
If it is a rising tide in Index Big Wind, most or almost all stock boats generally rise;
If it is a receding tide in Index Big Wind, most or almost all stock boats generally go lower.
Hence the importance of Big Wind Directions blown by Big Hands.


Click "Share" on the Facebook icon at the bottom of this thread if you like it, or 
if you would like to start a discussion about it with friends on your Facebook Wall.

Wednesday, 16 December 2015

Clorox Technical Analysis (NYSE: CLX): 16 December 2015, Wednesday, 9.55pm Singapore Time

Clorox Technical Analysis (NYSE: CLX): 
16 December 2015, Wednesday, 9.55pm Singapore Time

$130.00 will break up sharply.
Clorox will sterilize all the bears and flush them down the toilet bowl.

Free money raining from Helicopter Don.
Best of luck.

Donovan Norfolk Technical Rating:
Very Bullish Bias
Take profits at around $135.00


Click "Share" on the Facebook icon at the bottom of this thread if you like it, or 
if you would like to start a discussion about it with friends on your Facebook Wall.

Funds Flow Analysis (FFA): 16 December 2015, Wednesday, 9.30pm Singapore Time


Current Latest Computed Funds Flow Analysis (FFA):
For Worldwide Financial Markets:
16 December 2015, Wednesday, 9.30pm Singapore Time
Donovan Norfolk Ang Funds Flow Analysis Indicator 
for Worldwide Financial Markets 
16 December 2015, Wednesday

Broad Markets / Big Markets / Big Wind Directions

US markets (DJIA. S&P500 and NASDAQ) are 01 hour 00 minutes away from opening for trading while European markets are in the first 05 hour 00 minutes of trading.

Based on current latest computational results, Holdings Index Strength of Big Monies have changed from +10.000 (Maximum Strength Longs) to +10.000 (Maximum Strength Longs) in strength on the Donovan Norfolk Funds Flow Index Oscillator. On the other front, Big Monies flipped from Bearish Puts to Bullish Calls, with strength changed from -1.141 to +1.230 in strength on the Donovan Norfolk Funds Flow Index Oscillator.  

Big Money Aggregate Strength (posture) in holdings changed from +4.430 to +5.615 in strength (Smart Monies are Strong Strength Longs in Aggregated Holdings currently)


Broad Market (Big Wind Direction) Short-Term / Mid-Term Posture by Big Hands:

In the financial markets worldwide today:

+ Smart monies pushed down worldwide markets on 14th December and 15th December, but added longs during the suppression of the markets.
+ Retailers were shorting and dumping on fear, while smart monies were scooping up and buying the markets on fear.
+ Smart monies maintained MAXIMUM LONGS STRENGTH IN HOLDINGS.
+ Smart monies are dual longs in holding strength: Bullish Bias.
+ Short-Mid Term Uptrend.


Worldwide financial markets are executing the following basic technical structures:

+ Long term: Transition to Bear Markets
+ Mid term: Uptrend
+ Short term: Uptrend

The order of how individual stocks will transit into their individual bear markets respectively

While Long Term Major Top starts to form in indices worldwide, the following is the order of how individual stocks will transit into their individual bear market respectively:

1. Weakest stocks (2.27% of the entire broad market) will start to transit into their bear markets in 2012, making it 2.27% of the entire broad markets in bear market (market indices to still make highs). 

2. Weaker stocks (the next 13.59% of the broad market) will start to transit into their bear markets in 2013, making it 2.27%+13.59%=15.86% of the entire broad markets in bear market (market indices to still make new highs but with deceleration). 

3. Weak stocks (the next 34.13% of the broad market) will start to transit into their bear markets in 2014, making it 15.86%+34.13%=49.99% of the entire broad markets in bear market (market indices to consolidate and to peak out)

4. Strong stocks (the next 34.13% of the broad market) will start to transit into their bear markets in 2015, making it 49.99%+34.13%=84.12% of the entire broad markets in bear market (market indices to start to go downtrend)

5. The stronger and the strongest stocks (the remaining 15.88% of the broad market) will transit into their bear markets in 2016 onwards, making it 84.12%+15.88%=100% of the entire broad markets in bear market (market indices in bear market).

-----------------------------------------------------------------------------------------------------------------
Donovan Big Money Funds Flow Computational Oscillator
-----------------------------------------------------------------------------------------------------------------

Donovan's Funds Flow Analysis Index Oscillator:
-10 ----- 0 ------+10
Donovan's Funds Flow Analysis Strength-Index Scale Key:
negative (-ve) = shorting;
positive (+ve) = longing;
0.000-0.999: Neutral / Negligible Net Holdings
1.000-2.999: Weak strength / weak holdings
3.000-4.999: Moderate strength / moderate holdings
5.000-6.999: Strong strength / high holdings
7.000-8.999:Very strong strength / very high holdings
9.000-10.000:: Maximum strength / maximum holdings

Implication of Broad Markets/Big Markets/Big Wind Indices Directions
If it is a rising tide in Index Big Wind, most or almost all stock boats generally rise;
If it is a receding tide in Index Big Wind, most or almost all stock boats generally go lower.
Hence the importance of Big Wind Directions blown by Big Hands.


Click "Share" on the Facebook icon at the bottom of this thread if you like it, or 
if you would like to start a discussion about it with friends on your Facebook Wall.

Tuesday, 15 December 2015

Funds Flow Analysis (FFA): 15 December 2015, Tuesday, 6.22pm Singapore Time

15 December 2015 Worldwide Funds Flow Analysis (FFA):

Last Friday (11 December 2015): smart monies buy on a down day;
Monday (14 December 2015): smart monies buy on a down day.
Tuesday, today, 15 December 2015: smart monies consolidate and unload just a little on a directionless day.

Intention is clear: 
Markets still postured for bullish bias for the short-mid term. Big hands still max longs worldwide for short-mid term. 2015 Year End Rally and 2016 Start of the Year rally is still in place. Markets still postured for bullish bias for the short-mid term. Big hands still max longs worldwide for short-mid term.

Funds Flow Analysis to be continued from tomorrow onwards...