Ticker 1

Ticker 2

Click "Like" to Receive First Hand Updates From The Analysis Site / Click "SHARE" to share

Monday, 3 September 2012

Euro-USD: 3 September 2012, Monday, 9.30am

What a week we had last friday with Bernanke's speech at Jackson hole eh? The volatility was extreme, up and down 60pips within minutes.

For this coming week, it is a tough call. I do not know whether to be a bull or bear. The price action is calling for both directions!! Why? Lets begin with the daily chart. The daily charts shows a bearish price action.

On the daily chart, we see:
1. Price action is bearish with a clearly defined falling channel with 3 confirmed points
2. Price is touching potential point 4 for this week
3. Pivot zone resistance from 15th Jan 2012 at 1.2650

Euro USD (EURUSD) Daily Chart

On the 4hr chart, we see:
1. Price action is bullish with a rising channel with also 3 confirmed points
2. 1.2420-40 could be a new support zone

Euro USD (EURUSD) 4-Hour Chart

So what is the key to this dilemma? I think the key battle may be 1.2650.  

Bull traders:
1. Price must break above and stay above 1.2650 
2. Price to stay within 4hr rising channel 
3. Price to touch rising channel to form point 4 to create a 4th higher low in order to break above 1.2650

Bear traders:
1. Price fails to break above 1.2650
2. Reversal patterns such as double top or head and shoulders to form on 1hr or 4hr chart
3. Price must not form a point 4 on 4hr rising channel
4. Price must break out from the 4hr rising channel 


The following quality article is contributed by FMG who is an active forex trader. He is also the webmaster of http://www.forexmindgames.com/.


Thursday, 30 August 2012

Hang Seng Index Hourly: 30 August 2012, Thursday, 10.15am Singapore Time


Hang Seng Index Hourly: 30 August 2012, Thursday, 10.15am Singapore Time
Immediate Term Sell-down further executed today as expected 2 weeks ago
(Take Profits in Batches Now)
Reference: http://donovan-ang.blogspot.sg/search/label/Hang%20Seng%20Intraday


As expected, R1, R2, R3 and the important R4 as mentioned last week all held and suppressed. Furthermore, HSI was suppressed with a fake bullish ascending triangle; it is a double bearishness. Next target will be to test for Channel Supports as above.

Hang Seng Index Hourly: 22 August 2012, Wednesday, 8.38pm Singapore Time
Immediate Term Sell-down executed today as expected
http://donovan-ang.blogspot.sg/search/label/Hang%20Seng%20Intraday


As expected from last week, Hang Seng indeed went into an immediate term sell-down mode, creating Resistances R1, R2, R3 and R4 as above. These pose immediate selling pressures to cap further upsides and to limit the rate of momentum upwards. Immediate term carry on to be bearish, unless R4, R1 and R2 are captured in succession.


Hang Seng Index Hourly: 17 August 2012, Friday, 3.25pm Singapore Time
Immediate Term Sell-down executed today as expected


Above is where Hang Seng is selling currently based on Intra-day Technical Analysis. 
The immediate term selling is to be under-way and to execute.


Hang Seng Index Hourly: 16 August 2012, Thursday, 4.05pm Singapore Time
Immediate Term Sell-down executed today as expected


Above is where Hang Seng is selling currently based on Intra-day Technical Analysis. 
The immediate term selling is still under-way and execution in progress.
Hang Seng Index Hourly: 15 August 2012, Wednesday, 9.40am Singapore Time
Immediate Term Sell-down expected.


Hang Seng Index (HSI) is currently hitting major Intra-day Resistances at 20100-20188 pts with significant bearish divergences.

Bearishness sell-down in the immediate term is expected.

Sunday, 26 August 2012

Olam International: 26 August 2012, Sunday, 12.35pm

奥兰国际技术分析 :2012年8月26日,星期天,12.35pm


以下乃奥兰国际之详细技术分析,目前处于长空价构,不宜持有。若自己认不清或作不出判断,建议观望。量缩反弹后,卖压开始进场,没站上$2.19,视为弱势。目前形成弱势三角收敛结构,正等待另一轮往下跳水之贯杀行动。

奥兰国际技术分析 1:2012年8月26日,星期天,12.35pm

2010年8月、9月,大户趁大宗商品 (Commodities) 一片乐观,利用市场分析报告纷纷牛气升天、罗杰斯 (Rogers) 歪理蛊惑高唱大宗商品牛市之际,限额拉高再悄悄出货于散户,至2011年初维持粉红支持线盘整半年,沽货出场。

2011年初,趁价高、委买量高、大家误以为前景乐观之时,一口气大量出货,本地券商、经纪、投资者、散户、买家比比皆是,大户与内线利用分析报告、经济展望、罗杰斯影响等等轻易脱售离场。

奥兰国际技术分析 2:2012年8月26日,星期天,12.35pm

随之,假突破于2011年中得到确立(2011年4月至6月),技术面尽毁,大户加空,并持续放空。大宗商品之警钟正式敲响,不逃则亡。

奥兰国际技术分析 3:2012年8月26日,星期天,12.35pm

2011年后半年,最后垂死之挣扎(笔者于去年严重警告过投资者放量之卖压、汹涌之下杀将于2011年8月来临: http://www.youtube.com/watch?v=QroFRLSf16I 与 http://www.youtube.com/watch?v=T8pfhkQAiA4&feature=relmfu,果然,最后的逃命波盘旋以不稳定量作收为最终之告急警讯。

奥兰国际技术分析 4:2012年8月26日,星期天,12.35pm

市场、大户、内线于2012年中进行下杀套牢的第二波蓄意压低出货,显示奥兰国际随之进一步确立为中期、长期空头市场;2012年之下杀过程不足为奇。

奥兰国际技术分析 5:2012年8月26日,星期天,12.35pm

现行技术反弹接近尾声,并为量缩反弹,此乃另一警钟,小心为宜;没站上$2.19,视为弱势。目前形成弱势三角收敛结构,正等待另一轮往下跳水之贯杀行动。

以上技术分析可见股市正处于不乐观之状态,故小心为宜,以免步步惊心。奥兰国际也预示大宗商品 (Commodities) 将持续疲软 (Weakness)。

Friday, 24 August 2012

Parabolic Exponential Price Structure


Analysis of Parabolic Exponential Price Structure

Attached is a chart on Iron Ore. Its recent performances have raised eye-brows. 

In my judgement, it has satisfied its parabolic peak. We all know parabolic movements are never healthy, and they are often pre-signs of nasty storms. As with Iron Ore having made its last wave, commodities had also done so. They are highly likely to have reached their major peaks and going for long term commodities bear market. 

This was what used to be the no-brainer statement from Jim Rogers: "If US Economy and World Economies recover, commodities would fly because demand would be up; if US Economy and Western Economies do not recover, they will print money (esp US printing USD) to pay debts and stimulate growth, and these excess monies will jack up commodity prices." 

Hence the conclusion is a definite commodities long term bull market. It was very logical and a very hot statement, sucking in every possible money from traders, hedgers, retailers, investment funds, hedge funds and sovereign wealth funds (including Temasek/G.I.C towards Olam). However, is the financial market always a no-brainer? The market unfortunately likes to behave "dumb and brainless", thus having a preference to wipe out the smart and logical ones who are the majority. The minority (real market movers) accumulated shorts on them since 2010-2011 market phase with 2012 market phase as the killing phase (push down with deliberate volume). 

The initial phase of commodities distribution has been completed. It is the killing phase that the financial markets have entered into. Otherwise how do the minority and real powerful hands make a killing from the majority who had been brain-washed into optimism in commodities and commodity companies? 

From history, in a parabolic move of major index or single commodity, the average parabolic rate is a multiple of 9x (in 10years) on major index or single commodity. 4.5x is a first parabola resistance and 9x is the end of such parabola on average.


Thursday, 23 August 2012

Funds Flow Analysis (FFA): 23 August 2012, Thursday, 4.15pm Singapore Time


Latest Computed Funds Flow Analysis (FFA): 23 August 2012, Thursday, 4.15pm Singapore Time

Inflexion (Turning) Point Reached For Most Stocks and Inflexion Point approaching for World Indices in August 2012 for Final Re-Distribution (Bearish)
Refer http://donovan-ang.blogspot.sg/search/label/Funds%20Flow%20Analysis


As of current latest, Holdings index strength of Big Hands reduced again from +6.920 to +6.232 on the Donovan Funds Flow Index Oscillator, with the confirmation-probing as highlighted previously attempting a double confirmation for Bear Market Resumption; Big Hands' Calls Holdings reduced from +0.812 to +0.752 on the Donovan Funds Flow Index Oscillator Scale. 

Market at/nearing Inflexion Point for resumption of downwards movement as highlighted previously (In essence, limited upside with high downside now).

There is a high downside potential to be targeted and realised by the market. Firstly, from +10.0 to +0.0, an unload of contracts and stocks all the way to neutral zero; secondly, further selling down from +0.0 all the down to a potential -10.0 as a subsequent follow-up. 

In addition, the Donovan Big Hands Probing Hypothesis as illustrated 2 weeks ago has so far given the Bear Market Confirmation although market had successfully classical conditioned majority of market participants to see market strength which is essentially fake strength.

Meanwhile, Donovan Broad Market Short Term Shorting Intention (40days look-back window), Donovan-BMSTSI (40), changed from strength index 45.00% to 35.00% (Computation Completed: 23 August 2012, 8.00pm Singapore Time). 

Be cautious of the market, do not long or buy, especially for Blue Chips, Big Caps, Main Liner Stocks and Mid Cap Stocks, as BMSTSI immediate shorts are back, and Donovan Funds Flow Index Oscillator had hit reversal/inflexion point earlier. 

Attached below is the Singapore Straits Times Index Technical Analysis posted last week. For those who still do not know what is happening, market technical rebound was approaching its end as previously highlighted:
  
Chart of Straits Times Index of 15 Aug 2012

Overall Market Rating: 
Sideline from the markets whenever unsure. Advisable not to go long at all. Rather be safe than be sorry. Long/Buy/Invest wrongly and the market is likely to punish one harshly, especially since inflexion points are triggering. Shortists will not be punished. Olympics has just ended and is likely to follow the past traditions of sell-down resumption right after Olympics.


Donovan Big Hands Funds Flow Computational Oscillator

Donovan's Funds Flow Analysis Index Oscillator:
-10 ----- 0 ------+10
Donovan's Funds Flow Analysis Strength-Index Scale Key:
negative (-ve) = shorting;
positive (+ve) = longing;
0: No shorts and no longs (direction-less)
1-2: Weak strength / weak holdings
3-4: Moderate strength / moderate holdings
5-6: Strong strength / high holdings
7-8:Very strong strength / very high holdings
9-10:: Rally Mode in store / Plunging Mode in store

Donovan's Daily Broad Market Short Term Shorting Intention (BMSTSI) Oscillator:
0% -----20-----50-----80-----100%
Donovan's Daily Broad Market Short Term Shorting Intention (BMSTSI) Index Scale Key:
0 to 10: Negligible Broad Market Shorting Activity Today
10 to 20: Very Weak Broad Market Shorting Activity Today
20 to 40: Weak Broad Market Shorting Activity Today
40 to 60: Moderate Broad Market Shorting Activity Today
60 to 80: Strong Broad Market Shorting Activity Today
80 to 90: Very Strong Broad Market Shorting Activity Today
90 to 100: Full or Best Effort Broad Market Shorting Activity Today

Home: http://donovan-ang.blogspot.sg/

Wednesday, 22 August 2012

Hang Seng Index Hourly: 22 August 2012, Wednesday, 8.38pm Singapore Time

Hang Seng Index Hourly: 22 August 2012, Wednesday, 8.38pm Singapore Time
Immediate Term Sell-down executed today as expected
http://donovan-ang.blogspot.sg/search/label/Hang%20Seng%20Intraday


As expected from last week, Hang Seng indeed went into an immediate term sell-down mode, creating Resistances R1, R2, R3 and R4 as above. These pose immediate selling pressures to cap further upsides and to limit the rate of momentum upwards. Immediate term carry on to be bearish, unless R4, R1 and R2 are captured in succession.


Hang Seng Index Hourly: 17 August 2012, Friday, 3.25pm Singapore Time
Immediate Term Sell-down executed today as expected


Above is where Hang Seng is selling currently based on Intra-day Technical Analysis. 
The immediate term selling is to be under-way and to execute.


Hang Seng Index Hourly: 16 August 2012, Thursday, 4.05pm Singapore Time
Immediate Term Sell-down executed today as expected


Above is where Hang Seng is selling currently based on Intra-day Technical Analysis. 
The immediate term selling is still under-way and execution in progress.
Hang Seng Index Hourly: 15 August 2012, Wednesday, 9.40am Singapore Time
Immediate Term Sell-down expected.


Hang Seng Index (HSI) is currently hitting major Intra-day Resistances at 20100-20188 pts with significant bearish divergences.

Bearishness sell-down in the immediate term is expected.

Saturday, 18 August 2012

US Dollar: 18 August 2012, Saturday, 7.00pm

US Dollar Technical Analysis: 18 August 2012, Saturday, 7.00pm

US Dollar is still in a strong and healthy uptrend. It will be foolish to be bullish of the financial markets, commodities and oil. 

Financial markets in Europe and Asia to remain in a BEAR MARKET;
Commodities to remain BEARISH;
Euro to remain in BEAR MARKET;
Oil to resume BEARISH;
Gold at INFLEXION/BEARISH

USD Price Satisfaction Target of $85.10-$86.10 has not been satisfied yet. Short-term still in downtrend consolidation, Mid-term Sideways consolidation and Long-term Uptrend.

Financial Markets in Asia and Europe are currently in short term uptrend (ENDING SOON BASED ON DONOVAN FUNDS FLOW ANALYSIS), Mid Term Sideways and Long Term BEAR MARKET that is still at early stage.

KepCorp: 18 August 2012, Saturday, 6.15pm


Keppel Corp: 18 August 2012, Saturday, 6.15pm

Keppel Corp is having a very unhealthy run at the moment. Immediate term selling is possible. Being world's number 1 oil rig builder, it has strong fundamentals and enjoys many competitive advantages over its peers. This enabled it to be the last to break critical supports and to carry on a forceful and hard-to-maintain uptrend.

Since KepCorp's high volume selling last year 2011 August, its recovery has not been supported with volume over the one year. This entire technical rebound could prove to be a mere larger escape wave, set-up by Big Hands to make use of its better-than-expected corporate news (news are laggards in markets) to distribute and get out. Together with the local bank stocks and Singapore REITS, KepCorp has also been one of the key STI component stock that had been supporting the Straits Times Index (STI), enabling STI to be one of the strongest in the world. This enables Big Hands to short MSCI Singapore (SiMSCI) futures and the Singapore indexes in general.

It is worth noting that KepCorp's past 2 months of run-up has been on thin volume, akin to a car running on thin ice. Be cautious: Once the triple supports (PINK, GREY AND ORANGE Supports) break down, the intentional Sell Volume will come. Breakdown of $10.80 will see longs trampling longs for a rush to exit doors.

Friday, 17 August 2012

Hang Seng Index Hourly: 17 August 2012, Friday, 3.25pm


Hang Seng Index Hourly: 17 August 2012, Friday, 3.25pm
Immediate Term Sell-down executed today as expected


Above is where Hang Seng is selling currently based on Intra-day Technical Analysis. 
The immediate term selling is to be under-way and to execute.


Hang Seng Index Hourly: 16 August 2012, Thursday, 4.05pm
Immediate Term Sell-down executed today as expected


Above is where Hang Seng is selling currently based on Intra-day Technical Analysis. 
The immediate term selling is still under-way and execution in progress.
Hang Seng Index Hourly: 15 August 2012, Wednesday, 9.40am
Immediate Term Sell-down expected.


Hang Seng Index (HSI) is currently hitting major Intra-day Resistances at 20100-20188 pts with significant bearish divergences.

Bearishness sell-down in the immediate term is expected.

Thursday, 16 August 2012

Hang Seng Index Hourly: 16 August 2012, Thursday, 4.05pm


Hang Seng Index Hourly: 16 August 2012, Thursday, 4.05pm
Immediate Term Sell-down executed today as expected


Above is where Hang Seng is selling currently based on Intra-day Technical Analysis. 
The immediate term selling is still under-way and execution in progress.
Hang Seng Index Hourly: 15 August 2012, Wednesday, 9.40am
Immediate Term Sell-down expected.


Hang Seng Index (HSI) is currently hitting major Intra-day Resistances at 20100-20188 pts with significant bearish divergences.

Bearishness sell-down in the immediate term is expected.

Wednesday, 15 August 2012

Straits Times Index: 15 August 2012, Wednesday, 11.45pm

Straits Times Index: 15 August 2012, Wednesday, 11.45pm

Straits Times Index: 15 August 2012, Wednesday

Straits Times Index is reaching Price Satisfaction Zone at 3128 points soon. Expect unloads to come. Upside is still possible but very limited. Volume is unstable, suggesting the dead cat bounce is going to end soon. The Donovan-Ang Big Hands Probing Hypothesis is completed in August, confirming a Bear Market in its initial phase in Singapore. Based on Funds Flow Analysis, Straits Times Index is at the triggering point zone of the Bear Market Resumption.

Be careful of your longs, investments, and buys if you are holding. It pays to sideline from the market unless one is shorting. Whenever unsure, sideline from the market. Ignorant investors, traders, small fishes, and market participants still holding to unwanted babies will have to repent when the intentional sell-down comes in worldwide markets.

Hang Seng Index Hourly: 15 August 2012, Wednesday, 9.40am


Hang Seng Index Hourly: 15 August 2012, Wednesday, 9.40am
Immediate Term Sell-down expected.


Hang Seng Index (HSI) is currently hitting major Intra-day Resistances at 20100-20188 pts with significant bearish divergences.

Bearishness sell-down in the immediate term is expected.

Tuesday, 14 August 2012

Groupon: 14 August 2012, Tuesday, 10.35pm

Groupon: 14 August 2012, Tuesday, 10.35pm
(NASDAQ: GRPN)

Groupon, GRPN, Technical Analysis:
Groupon, a failing business: 14 August 2012

From yesterday's close, Groupon (ticker @ NASDAQ: GRPN) will fall for another 50% in price to reach $3.705.
As early as 4 Nov 2012, Groupon was already sold away by those who knew the best in this business.

For another 2 months, Market gave many chances for late investors to run. Unstable volume from May 2012 to June 2012 with a decider downwards means disaster for the stock. Indeed it is on the way for more downside. Price structure remains bearish. Next target is $3.705.

Rating: Strong Sell/Short.

Monday, 13 August 2012

Jasper Investments: 13 August 2012, Monday, 11.00pm

Jasper Investments: 13 August 2012, Monday, 11.00pm


Jasper Technical Analysis: 8 August 2012


Latest Immediate Term Chart: 13 August 2012

Jasper Inv is getting ready again.

Sunday, 12 August 2012

Olam International: 12 August 2012, Sunday, 11.35pm

Olam: 12 August 2012, Sunday, 11.35pm

Olam has broken down after a long term distribution with strong intention to go into a long term shorting and selling structure. 

If Olam finds resistance at around estimate $2.13, its next target (mid-term) is $0.90.
Commodities rebound are coming to an end soon.

Note:
If Commodities go downhill, it is also a pre-signal of Singapore's economy going the same direction in the next few quarters.

Wednesday, 8 August 2012

Jasper Investments: 8 August 2012, Wednesday, 2.00pm

Jasper Investments: 8 August 2012, Wednesday, 2.00pm

Jasper Investment

Watch out for this penny stock. It is my long term investment. 
My invested price per share for long term on Jasper is lower than that of Temasek Holdings though.

Tuesday, 31 July 2012

Gold Market: 31 July 2012, Tuesday, 11.45pm

Gold Market: 31 July 2012, Tuesday, 11.45pm

Gold Market: Up-trend Ended with Strong Intention

Gold is about to finish its consolidation. Only a break-up above the red trend line will negate the damaged price structures and carry on a long term up-trend (Low probability). Otherwise, the Gold trend has been damaged. As early as July 2011 to October 2011, Big Hands had been inducing greed for distribution (Central Banks of Emerging Markets keep loading Gold, retailers buy up and loading Gold, and Gold became no brainer buy, with majority of market participants holding paper losses now based on volume analysis). The insiders have signalled their confirmation of intentions at the end of 2011 and during March 2012, dumping with acceleration. No insider is buying up Gold during this technical rebounds based on Price-Volume Analysis of last few months. If Gold is not even bought up, no one should even be bullish about stocks and the financial markets.

If one is still holding Gold investments and financial investments generally, one should be very cautious. Do not go into any longs in stocks, commodities, indices, futures, Gold and Silver. Calculated downside projection for Gold and Gold ETF as follows:


Gold Target = $1127.94

Donovan Rating: 
Short Commodities, Short Gold

Monday, 23 July 2012

Noble Group: 23 July 2012, Monday, 11.05pm Singapore Time

Noble Group: 23 July 2012, Monday, 11.05pm Singapore Time


Noble Group: Weak Price Structure in this commodity stock has broken down today; next phase of sell downs will eye immediately for
1. 85cents first Double Top Target 1
2. 80cents immediate waveform price satisfaction point.
3. 68cents Double Top Target 2
4. 57cents new purple price structure break-down target.

Donovan Rating: accumulate immediate SHORTS as indicated in Technical Analysis Chart. Short down this stock until capitulation selling (margin calls) and retailers/investors cannot breathe.

Looking to queue for more Shorts at $1.06 - $1.00 (Casting multi-layered net at this range)


LATEST UPDATE (24 JULY 2012, TUESDAY, 9.05AM, AT MARKET OPEN)
ADDITION OF NOBLE SHORTS ALL SUCCESSFULLY EXECUTED AT $1.05


Existing Noble Shorts, Refer:

http://donovan-ang.blogspot.sg/2012/06/latest-shorts-initiated-on-noble-group.html 

World markets are beginning the next phase of financial crisis and world trades are set to hit hard. Noble, a commodity stock, is now reacting and confirming to financial markets on the Bear Market in world trades. The major support is breached with intentional breaching volume. 
Noble is also a confirmation on weakness of BRICs, Brazil, Russia, India and China. The BRICs will have nasty Shortwaves coming (refer: http://donovan-ang.blogspot.sg/2012/07/donovan-bric-ex-russia-index-19-july.html)

Best of luck to your trades and investments.

Thursday, 19 July 2012

Added Trade: Genting SP Shorts, 19 July 2012, Thursday, 10.05am

Added Trade: Genting SP Shorts, 19 July 2012, Thursday, 10.05am
Previous batches of Genting Shorts are in the money. 
Added Genting Shorts at $1.32

Donovan-Singapore Banking Index: 19 July 2012, Thursday, 7.10am

Donovan-Singapore Banking Index: 19 July 2012, Thursday, 7.10am

Even the strongest group is coming to a short term reversal. This coincides with Big Hands Shorts as well as further sell-downs to be expected in STI, HSI, SENSEX, SSE (Shanghai Composite Index), KOSPI, FTSE MIB, IBEX, DAX, CAC, FTSE100, DJIA, STOXX 50, S&P500 and NASDAQ.


Monday, 16 July 2012

ING Groep NV (Dutch Banking Group) Technical Analysis: 16 July 2012, Monday, 11.35am Singapore Time

ING Groep NV (Dutch Banking Group) Technical Analysis: 16 July 2012, Monday, 11.35am Singapore Time

HIGH ALERT: 
Even Banking Groups outside the limelight of EU Zone are into trouble. 
Dominoes falling to accelerate soon. 

ING Groep NV: Triple High Selling Pressured Resistance exerted by the RED ZONE indicated. Weak Price Structure consolidation ended with breakdown of BLACK and ORANGE supports in 2011 and 2012; market patience with Eurozone has ended. Not only has Spain IBEX broken down the most critical of all critical supports, even those outside the limelight and had been quiet are facing judgement day music in Europe. 

Donovan Rating: accumulate next batch of mid term and long term SHORTS as indicated in Technical Analysis Chart (available for shorting in igmarkets)

The tornadoes are blowing strong. If one has any investments (exclude extremely undervalued penny stocks), one has to take necessary precautions. 

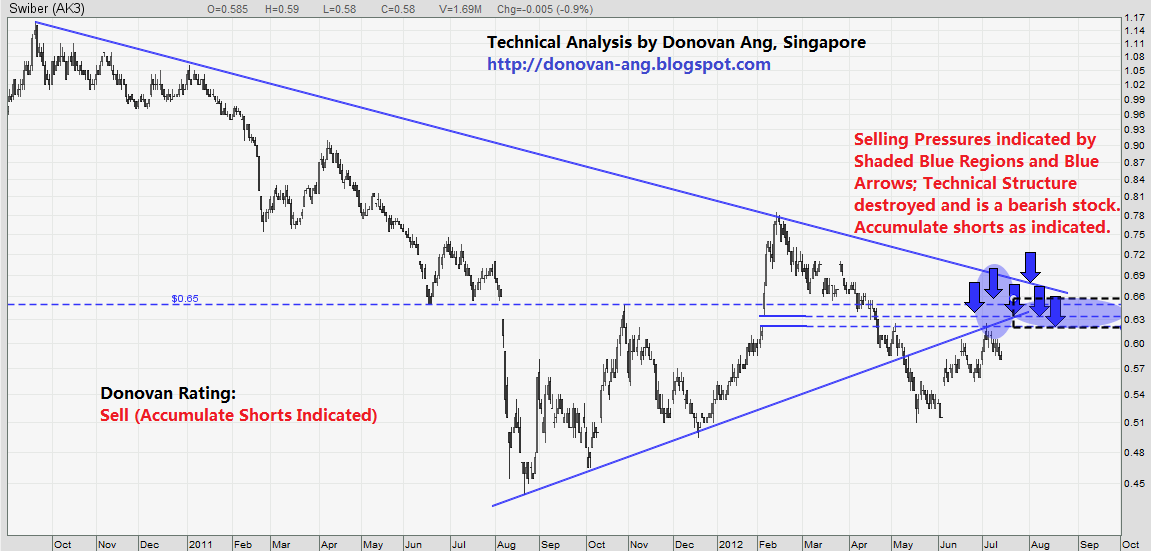
Swiber Technical Analysis: 16 July 2012, Monday, 7.30am Singapore Time


Swiber Technical Analysis: 16 July 2012, Monday, 7.30am Singapore Time

Swiber: Weak Price Structure.
Price of the company will collapse. Company is highly leveraged (high amount of debts and loans for operation), and under a new economic environment that is forward-looking, the company will go into distress or trouble:
1. US Dollar will hit bottom (because no more QE can be implemented anymore), and the rise in USD will cause oil prices to reverse to bearishness.
2. Even if oil price does not crush these highly leveraged oil and offshore companies, the interest rates that will rise from the rock bottom will crush them.

If boulder number 1 as above does not crush the stock price of such companies like Ezion, Ezra and Swiber, the next boulder number 2 that subsequently comes is equally deadly. Highly leveraged oil and offshore companies will either be severe casualty (50%-80% drop in prices), or die and rest in peace forever (bankruptcy and delisted).

Donovan Rating: accumulate long term SHORTS as indicated in Technical Analysis Chart.

Friday, 13 July 2012

Asian Markets: Prelude to European and US selldowns

13 July 2012, Friday, Singapore Time 8.30am
Friday the 13th: Asian futures are green and Asian markets not yet opened. US gapped-down opening yesterday night (Asian Time) followed by slow progressive recovery towards the close is a deliberate attempt to allow Asian futures to open green looking like buy-on-dip, but it is not. It is a technical Modus Operandi. From technical aspects, it is to continue with selldown mid day. This will induce a bearish and bloody European markets. Another sell down coming. Watch your front.

Saturday, 7 July 2012

US Dollar (USD): 7 July 2012, Saturday, 5.45pm Singapore Time

US Dollar (USD) Index: 7 July 2012, Saturday, 5.45pm Singapore Time


The US Dollar will carry on its rally from current point to above $85 in the short term, presenting the next sizeable upside.

DONOVAN RATING:
BUY (ACCUMULATE USD) FROM $81-$83 BEFORE ITS BREAKUP OF IMMEDIATE RESISTANCE AT $82.98.

Intermarket Analysis:
When the USD has consolidated for the next upmove, it means the world financial markets (Frankfurt DAX, London FTSE100, Paris CAC40, Milan MIB, Madrid IBEX, Hong Kong HSI, Seoul KOSPI, Taiwan Taiex, Tokyo NIKKEI, Singapore SiMSCI/STI, Delhi SENSEX, Australia ASX, Shanghai SSE), Commodities, Gold, Silver, Oil and major currencies against USD such as AUD-USD and Euro-USD are soon to be finished with their technical rebounds, and about to finish consolidation for the next wave sell-downs.