Straits Times Index:
19 June 2018, Tuesday, 2.20pm Singapore Time
(Click on Technical Chart above to Expand)
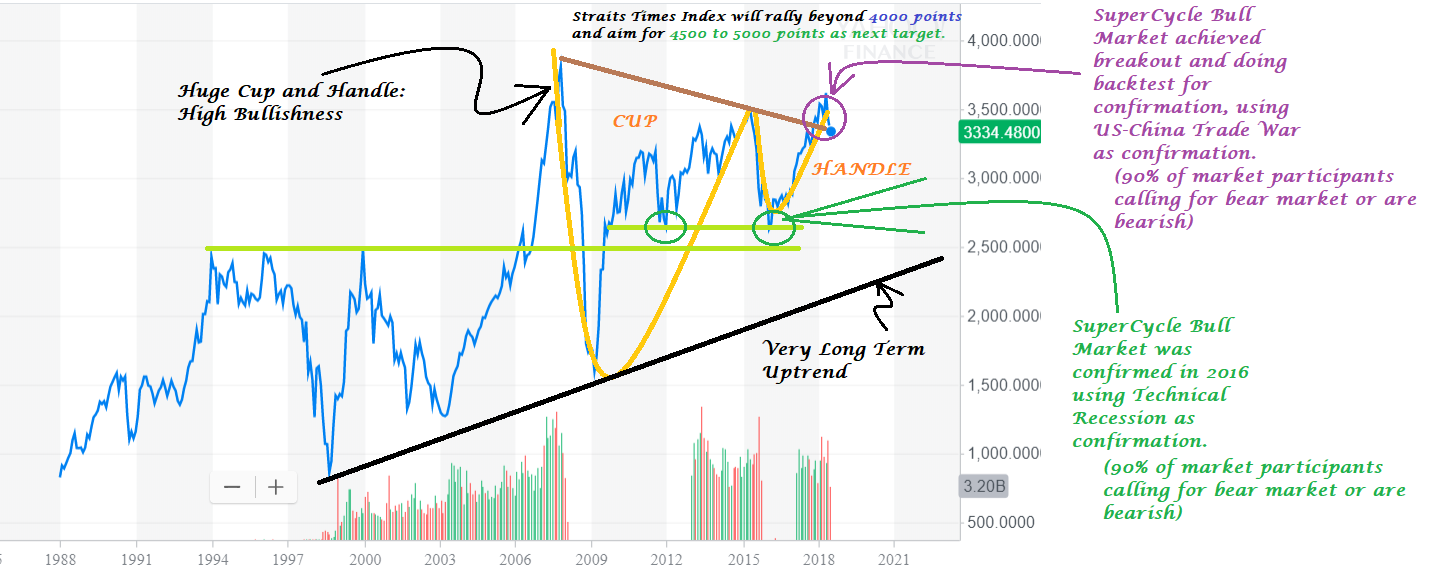
Attached is even more detailed technical explanations of the Singapore Straits Times Index. The green circled region pointed by the green arrow is the SuperCycle Bull Market confirmation made in 2016 -- using Technical Recession and extreme fear as confirmation of bull market (causing 90% market participants to be wrongly bearish back then and missing out on an almost +200% i.e. 2x move in DBS Bank, my top stock). Markets rallied after that per my precision forewarned rally.
The Technical Price Structure in Orange is the Cup and Handle formation. It is large and it is bullish. It has broken up the neckline resistance in brown, meaning the markets are brewing for large scale upmove. The purple circled region is the Super-Cycle Bull Market achieving another breakup of resistance, a double confirmation of big bull market, and doing backtest of the brown neckline resistance-turned-support currently -- this time using US-China Trade War and extreme fear as confirmation of bull market (causing 90% market participants to be bearish just like in 2016 back then, meaning DBS Bank, my top stock, will move again another +200% i.e. 2x from here). We are currently in Super-Cycle Super Bull Market despite trade tensions between US and China.

No comments:
Post a Comment