Chart 1:
Greece Athens Stock Exchange General Index (ASE):
24 June 2014, Tuesday, 9.55pm Singapore Time
Chart courtesy of StockCharts.com
Technical Analysis of the Greek Athens Stock Exchange General Index (ASE)
is as per illustrated in Weekly Chart 1 above:
+ Ascending Wedge Escape Wave created since end of 2011 is ending soon.
+ This entire wave from 2011 to 2014 has been a large re-distribution of stocks-equities to the general market.
Chart 2:
Greece Athens Stock Exchange General Index (ASE):
24 June 2014, Tuesday, 9.55pm Singapore Time
Chart courtesy of StockCharts.com
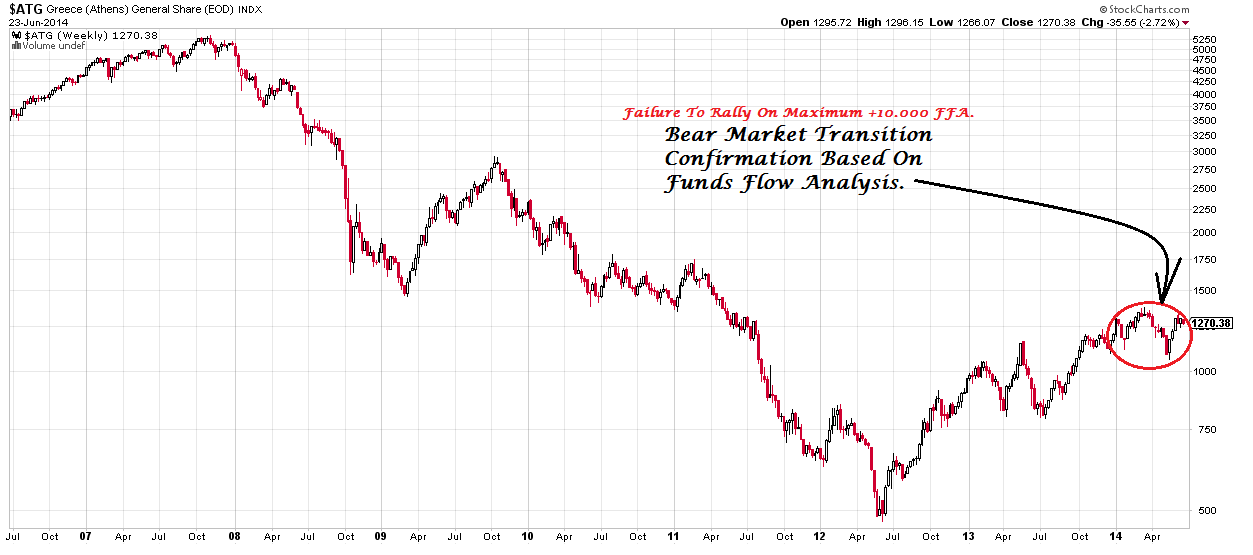
Chart 2 shows the RED Circled Region where Funds Flow Analysis since end-2013 and 1H-2014 repeatedly signals end of dead cat bouncing bull market and transition to bear market in 2014.
Chart 3:
Greece Athens Stock Exchange General Index (ASE):
24 June 2014, Tuesday, 9.55pm Singapore Time
Chart courtesy of StockCharts.com
In Chart 3, after forming a potential bullish Reverse Shoulder-Head-Shoulder, Greek Markets failed to break up and rally on opportunistic +10.000 maximum FFA. This is bearish in nature, suggesting Smart Money and Big Hands have been suppressing and re-shorting the financial markets. Such an action is bearish in nature and has been well timed worldwide.
Chart 4:
Greece Athens Stock Exchange General Index (ASE):
24 June 2014, Tuesday, 9.55pm Singapore Time
Chart courtesy of StockCharts.com
Chart 4 above shows the Price Satisfaction Zone of 1270-1476 points for escape wave created by ECB to end.
Chart 5:
Greece Athens Stock Exchange General Index (ASE):
24 June 2014, Tuesday, 9.55pm Singapore Time
Chart courtesy of StockCharts.com
Finally, Chart 5 shows the Secular Bear Market Trend of the Greek economy and financial markets.
This rebound as highlighted by the black support-resistance lines and dark brown lines indicate that the entire cyclical larger wave rebound is reaching its end phase. Markets are a sell on rebounds and get out stage now, in sync with all other markets worldwide as per highlighted previously.
The Secular Bear Market Confirmation in Eurozone Debtor Nations have been executed with success.
Donovan Norfolk Technical Rating:
Bearish
Bear Market Transition
(Sell on Rebounds)
Bearish
Bear Market Transition
(Sell on Rebounds)
Click "Share" on the Facebook icon at the bottom of this thread if you like it, or
if you would like to start a discussion about it with friends on your Facebook Wall.


No comments:
Post a Comment