Ticker 1

Ticker 2

Click "Like" to Receive First Hand Updates From The Analysis Site / Click "SHARE" to share

Tuesday, 26 January 2016

Brent Crude Oil Technical Analysis: 26 January 2016, Tuesday, 10.40pm Singapore Time

Brent Crude Oil Technical Analysis: 
26 January 2016, Tuesday, 10.40pm Singapore Time

Attached above is the 4 Hourly Chart for Brent Crude Oil. 
Note that Brent Oil is slightly different from US Light Crude Oil (WTI Oil).

Technical Analysis as illustrated on chart.
If Blue Band Support and Yellow Band Support both hold, the price satisfaction target is $35.00

Immediate Term Target:
Around $35.00


Click "Share" on the Facebook icon at the bottom of this thread if you like it, or 
if you would like to start a discussion about it with friends on your Facebook Wall.

Funds Flow Analysis (FFA): 26 January 2016, Tuesday, 7.25pm Singapore Time


Current Latest Computed Funds Flow Analysis (FFA):
For Worldwide Financial Markets:
26 January 2016, Tuesday, 7.25pm Singapore Time
Donovan Norfolk Ang Funds Flow Analysis Indicator 
for Worldwide Financial Markets 
26 January 2016, Tuesday

Broad Markets / Big Markets / Big Wind Directions

US markets (DJIA. S&P500 and NASDAQ) are 03 hours 05 minutes away from opening for trading while European markets are in the first 03 hours 25 minutes of trading.

Based on current latest computational results, Holdings Index Strength of Big Monies have changed from +10.000 (Maximum Strength Longs) to +10.000 (Maximum Strength Longs) in strength on the Donovan Norfolk Funds Flow Index Oscillator. On the other front, Smart Monies' Bullish Calls Holdings on hand changed from +1.766 to +1.514 in strength on the Donovan Norfolk Funds Flow Index Oscillator.  

Big Money Aggregated Strength (posture) in holdings changed from +5.883 to +5.757 in strength (Smart Monies are Strong Strength Longs in Aggregated Holdings Currently)

Broad Market (Big Wind Direction) Short-Term / Mid-Term Posture by Big Hands:

In the financial markets worldwide today:

+ Worldwide Smart Monies maintain MAXIMUM LONGS STRENGTH IN HOLDINGS irregardless of market volatility in any direction
+ Worldwide Smart monies consolidated their bullish calls in holdings.
+ Worldwide Smart Monies are dual longs in holdings.
+ Worldwide Smart Monies are bullish biased in the short-mid term.
+ There is no protection against any downside (i.e. bullish)
+ Lunar New Year/Chinese New Year Worldwide Stock Market Rallies may be expected.
+ May everyone be blessed with the best of luck. 

+ For 2016, US markets of Dow Jones Industrial Avg, S&P 500 and NASDAQ composite are still expected to break up more all time new highs since 2008 financial crisis.

Worldwide financial markets are executing the following basic technical structures:

+ Long term: Last wave up for US markets; Transition to Bear Markets for Asia 
+ Mid term:  Escape Wave
+ Short term: Uptrend

The order of how individual stocks will transit into their individual bear markets respectively

While Long Term Major Top starts to form in indices worldwide, the following is the order of how individual stocks will transit into their individual bear market respectively:

1. Weakest stocks (2.27% of the entire broad market) will start to transit into their bear markets in 2012, making it 2.27% of the entire broad markets in bear market (market indices to still make highs). 

2. Weaker stocks (the next 13.59% of the broad market) will start to transit into their bear markets in 2013, making it 2.27%+13.59%=15.86% of the entire broad markets in bear market (market indices to still make new highs but with deceleration). 

3. Weak stocks (the next 34.13% of the broad market) will start to transit into their bear markets in 2014, making it 15.86%+34.13%=49.99% of the entire broad markets in bear market (market indices to consolidate and to peak out)

4. Strong stocks (the next 34.13% of the broad market) will start to transit into their bear markets in 2015, making it 49.99%+34.13%=84.12% of the entire broad markets in bear market (market indices to start to go downtrend)

5. The stronger and the strongest stocks (the remaining 15.88% of the broad market) will transit into their bear markets in 2016 onwards, making it 84.12%+15.88%=100% of the entire broad markets in bear market (market indices in bear market).

-----------------------------------------------------------------------------------------------------------------
Donovan Big Money Funds Flow Computational Oscillator
-----------------------------------------------------------------------------------------------------------------

Donovan's Funds Flow Analysis Index Oscillator:
-10 ----- 0 ------+10
Donovan's Funds Flow Analysis Strength-Index Scale Key:
negative (-ve) = shorting;
positive (+ve) = longing;
0.000-0.999: Neutral / Negligible Net Holdings
1.000-2.999: Weak strength / weak holdings
3.000-4.999: Moderate strength / moderate holdings
5.000-6.999: Strong strength / high holdings
7.000-8.999:Very strong strength / very high holdings
9.000-10.000:: Maximum strength / maximum holdings

Implication of Broad Markets/Big Markets/Big Wind Indices Directions
If it is a rising tide in Index Big Wind, most or almost all stock boats generally rise;
If it is a receding tide in Index Big Wind, most or almost all stock boats generally go lower.
Hence the importance of Big Wind Directions blown by Big Hands.


Click "Share" on the Facebook icon at the bottom of this thread if you like it, or 
if you would like to start a discussion about it with friends on your Facebook Wall.

EURUSD Daily and 4-Hourly Chart Technical Analysis: 26 January 2016, Tuesday, 8.48am Singapore Time

EURUSD Daily Chart Technical Analysis: 
26 January 2016, Tuesday, 8.48am Singapore Time

Battle results in daily chart as above.

EURUSD 4-Hourly Chart Technical Analysis: 
26 January 2016, Tuesday, 8.48am Singapore Time

Battle results in 4-hourly chart as above.

Japanese Goku is hiding inside the blanket. He don't want to ride on the clouds. He says it is not time to wake up yet, and he should lie down and sleep more first. He thinks he needs to sleep more, only then can he recover from his sickness.

Click "Share" on the Facebook icon at the bottom of this thread if you like it, or 
if you would like to start a discussion about it with friends on your Facebook Wall.

Australia ASX 200 Index: 26 January 2016, Tuesday, 8.28am Singapore Time

Australia ASX 200 Index: 
26 January 2016, Tuesday, 8.28am Singapore Time

Attached is the Australia ASX 200 Intraday Chart.
Illustrated above is what Australian markets are trying to do at 4850-4950 points (Green Circle and Orange Box Zone): to backtest buying buying-support zones.

It is an illustration of what worldwide markets are trying to do right now as well.
All backtests of supports done this week have to be successful, otherwise markets will go into very bad shape.


Click "Share" on the Facebook icon at the bottom of this thread if you like it, or 
if you would like to start a discussion about it with friends on your Facebook Wall.

Monday, 25 January 2016

Funds Flow Analysis (FFA): 25 January 2016, Monday, 6.40pm Singapore Time


Current Latest Computed Funds Flow Analysis (FFA):
For Worldwide Financial Markets:
25 January 2016, Monday, 6.40pm Singapore Time


Donovan Norfolk Ang Funds Flow Analysis Indicator 
for Worldwide Financial Markets 
25 January 2016, Monday

Broad Markets / Big Markets / Big Wind Directions

US markets (DJIA. S&P500 and NASDAQ) are 03 hours 50 minutes away from opening for trading while European markets are in the first 02 hours 40 minutes of trading.

Based on current latest computational results, Holdings Index Strength of Big Monies have changed from +10.000 (Maximum Strength Longs) to +10.000 (Maximum Strength Longs) in strength on the Donovan Norfolk Funds Flow Index Oscillator. On the other front, Smart Monies' Bullish Calls Holdings on hand changed from +1.210 to +1.766 in strength on the Donovan Norfolk Funds Flow Index Oscillator.  

Big Money Aggregated Strength (posture) in holdings changed from +5.605 to +5.883 in strength (Smart Monies are Strong Strength Longs in Aggregated Holdings Currently)

Broad Market (Big Wind Direction) Short-Term / Mid-Term Posture by Big Hands:

In the financial markets worldwide today:

+ Worldwide Smart Monies maintain MAXIMUM LONGS STRENGTH IN HOLDINGS irregardless of market volatility in any direction
+ Worldwide Smart monies increased their bullish calls in holdings.
+ Worldwide Smart Monies are dual longs in holdings.
+ Worldwide Smart Monies are bullish biased in the short-mid term.
+ There is no protection against any downside (i.e. bullish)
+ Lunar New Year/Chinese New Year Worldwide Stock Market Rallies may be expected.
+ May everyone be blessed with the best of luck. 

+ For 2016, US markets of Dow Jones Industrial Avg, S&P 500 and NASDAQ composite are still expected to break up more all time new highs since 2008 financial crisis.

Worldwide financial markets are executing the following basic technical structures:

+ Long term: Last wave up for US markets; Transition to Bear Markets for Asia 
+ Mid term: Consolidation Ending
+ Short term: Uptrend

The order of how individual stocks will transit into their individual bear markets respectively

While Long Term Major Top starts to form in indices worldwide, the following is the order of how individual stocks will transit into their individual bear market respectively:

1. Weakest stocks (2.27% of the entire broad market) will start to transit into their bear markets in 2012, making it 2.27% of the entire broad markets in bear market (market indices to still make highs). 

2. Weaker stocks (the next 13.59% of the broad market) will start to transit into their bear markets in 2013, making it 2.27%+13.59%=15.86% of the entire broad markets in bear market (market indices to still make new highs but with deceleration). 

3. Weak stocks (the next 34.13% of the broad market) will start to transit into their bear markets in 2014, making it 15.86%+34.13%=49.99% of the entire broad markets in bear market (market indices to consolidate and to peak out)

4. Strong stocks (the next 34.13% of the broad market) will start to transit into their bear markets in 2015, making it 49.99%+34.13%=84.12% of the entire broad markets in bear market (market indices to start to go downtrend)

5. The stronger and the strongest stocks (the remaining 15.88% of the broad market) will transit into their bear markets in 2016 onwards, making it 84.12%+15.88%=100% of the entire broad markets in bear market (market indices in bear market).

-----------------------------------------------------------------------------------------------------------------
Donovan Big Money Funds Flow Computational Oscillator
-----------------------------------------------------------------------------------------------------------------

Donovan's Funds Flow Analysis Index Oscillator:
-10 ----- 0 ------+10
Donovan's Funds Flow Analysis Strength-Index Scale Key:
negative (-ve) = shorting;
positive (+ve) = longing;
0.000-0.999: Neutral / Negligible Net Holdings
1.000-2.999: Weak strength / weak holdings
3.000-4.999: Moderate strength / moderate holdings
5.000-6.999: Strong strength / high holdings
7.000-8.999:Very strong strength / very high holdings
9.000-10.000:: Maximum strength / maximum holdings

Implication of Broad Markets/Big Markets/Big Wind Indices Directions
If it is a rising tide in Index Big Wind, most or almost all stock boats generally rise;
If it is a receding tide in Index Big Wind, most or almost all stock boats generally go lower.
Hence the importance of Big Wind Directions blown by Big Hands.


Click "Share" on the Facebook icon at the bottom of this thread if you like it, or 
if you would like to start a discussion about it with friends on your Facebook Wall.

Hang Seng Index Technical Analysis: 25 January 2016, Monday, 10.59am Singapore Time

Hang Seng Index Technical Analysis: 
25 January 2016, Monday, 10.59am Singapore Time


This bear market rally in 2016 will make a confirmation of Hong Kong's Bear Market if the treacherous backtest of support-turned-resistance is successful.

I am back for some Hong Kong actions today. I am buying the breakdown when markets are too full of rampant shorts. Smart monies will wipe out shortists like how you finish your business, wipe your backside, throw the toilet paper full of shorts and finally flush it all gone. Cleaning job by markets to come.

Bullish escape wave is coming. After markets finish eating the yummy shorts, markets are then free to invite the bear to go for some diarrhoea session again.


Click "Share" on the Facebook icon at the bottom of this thread if you like it, or 
if you would like to start a discussion about it with friends on your Facebook Wall.

EURUSD Technical Analysis: 25 January 2016, Monday, 6.55am Singapore Time

EURUSD Technical Analysis: 
25 January 2016, Monday, 6.55am Singapore Time

Attached above is the technical analysis of the EURUSD. 
All analyses and judgement are illustrated in chart above.


Click "Share" on the Facebook icon at the bottom of this thread if you like it, or 

if you would like to start a discussion about it with friends on your Facebook Wall.

Friday, 22 January 2016

GBPCAD Technical Analysis: 22 January 2016, Friday, 9.10pm Singapore Time

GBPCAD Technical Analysis: 
22 January 2016, Friday, 9.10pm Singapore Time

Attached above is the GBPCAD 4-Hourly Chart.
Technical Analysis as illustrated on chart.
Breakdown of dual important supports.
There is a show of intention on the direction: down (bearish/short).
Be careful of the British Pound. Seems like it is bearish against all forex pairs.


Click "Share" on the Facebook icon at the bottom of this thread if you like it, or 
if you would like to start a discussion about it with friends on your Facebook Wall.

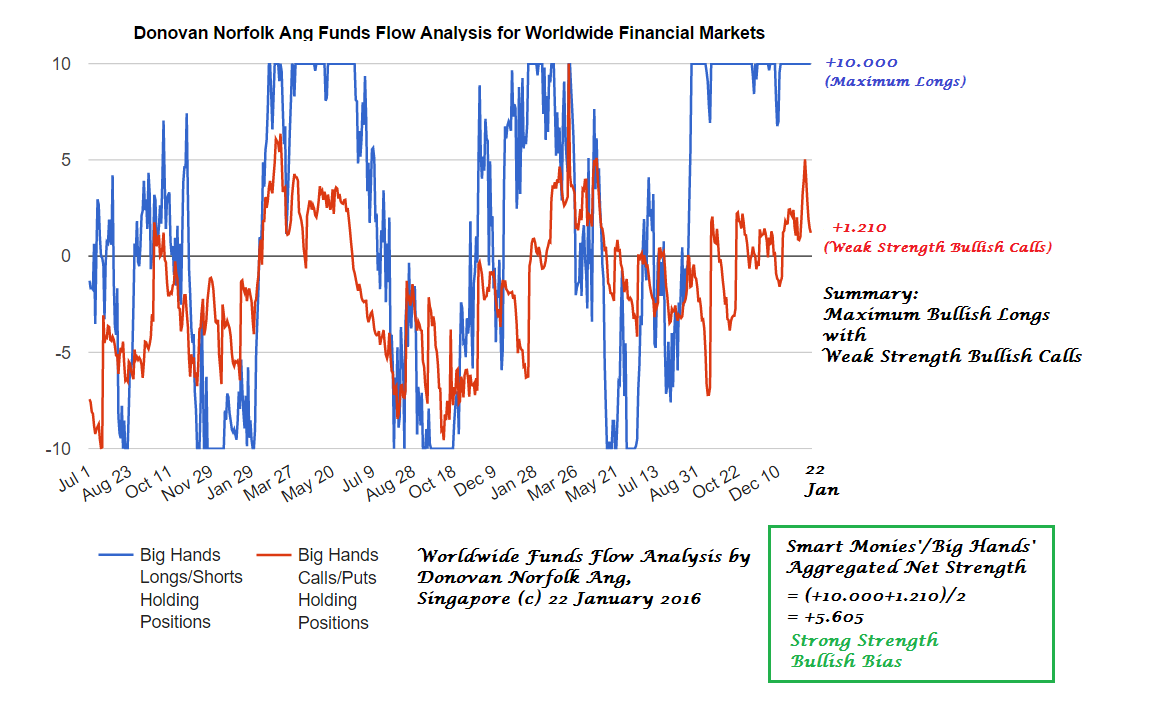
Funds Flow Analysis (FFA): 22 January 2016, Friday, 8.42pm Singapore Time


Current Latest Computed Funds Flow Analysis (FFA):
For Worldwide Financial Markets:
22 January 2016, Friday, 8.42pm Singapore Time
Donovan Norfolk Ang Funds Flow Analysis Indicator 
for Worldwide Financial Markets 
22 January 2016, Friday

Broad Markets / Big Markets / Big Wind Directions

US markets (DJIA. S&P500 and NASDAQ) are 01 hour 48 minutes away from opening for trading while European markets are in the first 04 hours 42 minutes of trading.

Based on current latest computational results, Holdings Index Strength of Big Monies have changed from +10.000 (Maximum Strength Longs) to +10.000 (Maximum Strength Longs) in strength on the Donovan Norfolk Funds Flow Index Oscillator. On the other front, Smart Monies' Bullish Calls Holdings on hand changed from +1.450 to +1.210 in strength on the Donovan Norfolk Funds Flow Index Oscillator.  

Big Money Aggregated Strength (posture) in holdings changed from +5.725 to +5.605 in strength (Smart Monies are Strong Strength Longs in Aggregated Holdings Currently)

Broad Market (Big Wind Direction) Short-Term / Mid-Term Posture by Big Hands:

In the financial markets worldwide today:

+ Worldwide Smart Monies maintain MAXIMUM LONGS STRENGTH IN HOLDINGS irregardless of market volatility in any direction
+ Worldwide Smart monies reduced their bullish calls in holdings.
+ There is still no protection against any downside (bullish)

+ For 2016, US markets of Dow Jones Industrial Avg, S&P 500 and NASDAQ composite are still expected to break up more all time new highs since 2008 financial crisis.

Worldwide financial markets are executing the following basic technical structures:

+ Long term: Last wave up for US markets; Transition to Bear Markets for Asia 
+ Mid term: Consolidation Ending
+ Short term: Uptrend

The order of how individual stocks will transit into their individual bear markets respectively

While Long Term Major Top starts to form in indices worldwide, the following is the order of how individual stocks will transit into their individual bear market respectively:

1. Weakest stocks (2.27% of the entire broad market) will start to transit into their bear markets in 2012, making it 2.27% of the entire broad markets in bear market (market indices to still make highs). 

2. Weaker stocks (the next 13.59% of the broad market) will start to transit into their bear markets in 2013, making it 2.27%+13.59%=15.86% of the entire broad markets in bear market (market indices to still make new highs but with deceleration). 

3. Weak stocks (the next 34.13% of the broad market) will start to transit into their bear markets in 2014, making it 15.86%+34.13%=49.99% of the entire broad markets in bear market (market indices to consolidate and to peak out)

4. Strong stocks (the next 34.13% of the broad market) will start to transit into their bear markets in 2015, making it 49.99%+34.13%=84.12% of the entire broad markets in bear market (market indices to start to go downtrend)

5. The stronger and the strongest stocks (the remaining 15.88% of the broad market) will transit into their bear markets in 2016 onwards, making it 84.12%+15.88%=100% of the entire broad markets in bear market (market indices in bear market).

-----------------------------------------------------------------------------------------------------------------
Donovan Big Money Funds Flow Computational Oscillator
-----------------------------------------------------------------------------------------------------------------

Donovan's Funds Flow Analysis Index Oscillator:
-10 ----- 0 ------+10
Donovan's Funds Flow Analysis Strength-Index Scale Key:
negative (-ve) = shorting;
positive (+ve) = longing;
0.000-0.999: Neutral / Negligible Net Holdings
1.000-2.999: Weak strength / weak holdings
3.000-4.999: Moderate strength / moderate holdings
5.000-6.999: Strong strength / high holdings
7.000-8.999:Very strong strength / very high holdings
9.000-10.000:: Maximum strength / maximum holdings

Implication of Broad Markets/Big Markets/Big Wind Indices Directions
If it is a rising tide in Index Big Wind, most or almost all stock boats generally rise;
If it is a receding tide in Index Big Wind, most or almost all stock boats generally go lower.
Hence the importance of Big Wind Directions blown by Big Hands.


Click "Share" on the Facebook icon at the bottom of this thread if you like it, or 
if you would like to start a discussion about it with friends on your Facebook Wall.