10 July 2018, Tuesday, 9.36pm Singapore Time
(Click on Funds Flow Chart above to Expand)
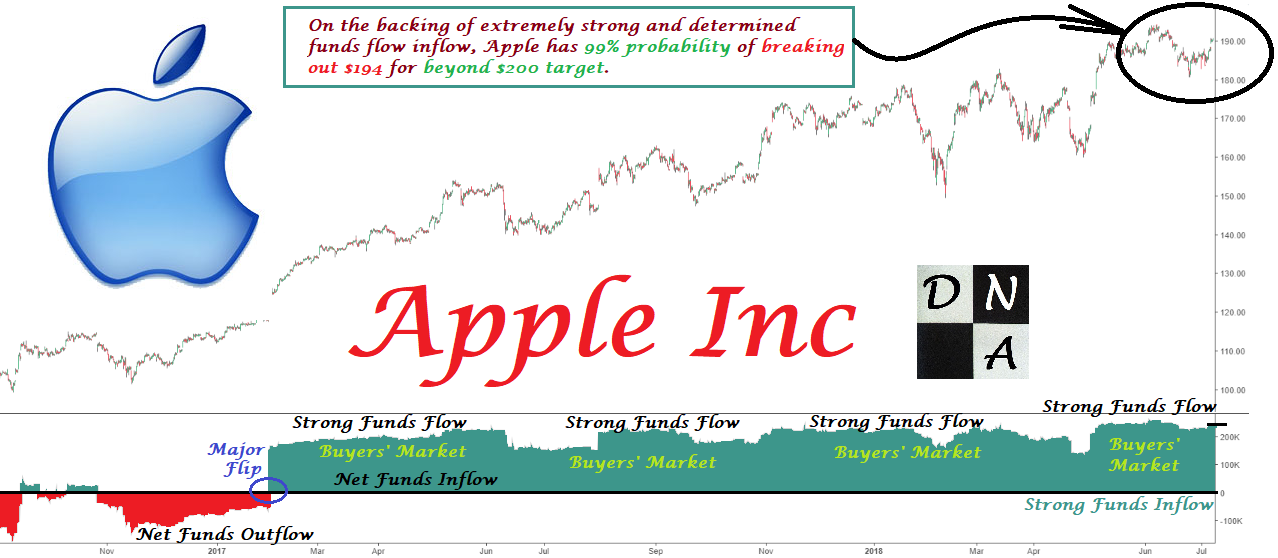
Attached is the funds flow analysis of Apple Inc that is listed in the US market (NASDAQ: AAPL). The red region illustrates where the stock experienced net funds flow outflow while the green region illustrates where the stock received funds flow net inflow from the international market. The blue circled region is the region of flip from funds outflow to funds inflow (impulsive flip). Thereafter, Apple began its resumption of upmove from $125 to $194 per share. Apple Inc has retraced to $190.58 region under the backdrop of very powerful funds flow net inflow. On the backing of extremely strong and determined funds flow inflow, Apple has 99% probability of breaking out $194 for beyond $200 target.

No comments:
Post a Comment