Ticker 1

Ticker 2

Click "Like" to Receive First Hand Updates From The Analysis Site / Click "SHARE" to share

Thursday, 31 May 2018

Hibiscus Petroleum: 31 May 2018, Thursday, 11.58am Singapore Time

Hibiscus Petroleum: 
31 May 2018, Thursday, 11.58am Singapore Time
(Click on Technical Chart above to Expand)

Attached is the Technicals for Hibiscus Petroleum (KLSE: 5199). This company from the energy/crude oil sector has been on a massively large re-accumulation using a large Inverse Shoulder-Head-Shoulder price structure. The Inverse Neckline is at around $1.04 area and awaiting for break-up. The orange trajectory is the expected path after an inverse SHS breakout. The volume flow shows that fools had been selling and exiting while Smart Monies had been entering secretly. Next targets projected from the price structure will be $1.50 and $1.70 respectively, before $2.00 will be hit. My Hisbiscus bought at below $0.30 will give me more than +500% milestone. My eventual target is +1000% profits as reiterated in my live trades previously if you had been following me closely.

Sunday, 27 May 2018

Funds Flow Analysis of Malaysia Stock Market (KLCI/KLSE): 27 May 2018, Sunday, 4.07pm Singapore Time

Funds Flow Analysis of Malaysia Stock Market (KLCI): 
27 May 2018, Sunday, 4.07pm Singapore Time
(Click on In-Depth Funds Flow Analysis Chart above to Expand)

Attached above is the Funds Flow of Malaysia Stock Market (FTSE Bursa KLCI in KLSE). In 1H-2016, Malaysia markets received large inflows in funds flow tide. This set up the Confidence Pivot (Stage 1a) in the realm of Funds Flow as a benchmark for future confidence motion. Notice in end-2016, when the large symmetrical triangle broke down, there was not much funds outflow from the market. This was where I had forewarned there will be no bear market at all for Malaysia and called for the buy on dips. Indeed in January 2017, per my reiterations to buy on dips, KLCI flipped from outflow to inflow, enacting all my fore-warnings, and negated the fake breakdown. This was then followed by confidence motion in 1H-2017 (which if passed the confidence test that was set up by previous max funds flow in 2016, the markets will super rally per my forewarnings). Indeed, markets did exactly per my directions too. 

In mid-2017, the markets in Malaysia once again set up another confidence pivot (stage 2a) using maximal funds flow inflow. This confidence pivot will have to be tested by a confidence motion in the future. Indeed, in May 2018, right after the PRU14 (Malaysian General Election 14 of Year 2018), the markets are doing this confidence motion now. Although year 2018 YTD (year to date) has currently seen a net funds flow outflow from the market, however this is just a short term outflow, and the market had already received large funds flow inflow for 2017 and 2016. In the 2016/2017 to 2018 long term, the market in Malaysia is actually persistently in a state of long term net funds flow inflow.

A real bearish market will have flipped into RED long term funds flow outflow strongly just before election and right after election. However, this did not happen for Malaysia. Instead, the funds flow trail is merely doing the confidence motion of Stage 2b which if passed like what it did in stage 1b will cause a superbly powerful rally just like stage 1b. These are all normal market actions. Funds flow trail in the market does not suggest inconfidence and there are still plenty of liquidity which wants to catch stocks on the dip. This is what I would term as a STRONG BULL MARKET that is still intact. I would judge that the current funds flow confidence motion will pass and not fail. Once passed, KLCI will rally again for all time new highs. 

Already, in my previous analysis, I had projected Malaysia Ringgit to have strong downside weakness in the short term, mid term and long term (refer to MYR inter-asset class link as attached below). Hence banks, commodities (soft commodities and hard commodities) and exports/export-oriented companies will be the strongest buy-up theme of play for Malaysia in the coming few years). These sectors will be most responsible for driving the KLCI up to all time new highs.

Friday, 25 May 2018

SGDMYR (Singapore Dollar against Malaysia Ringgit): 25 May 2018, Friday, 12.22pm Singapore Time

SGDMYR Chart 1(Singapore Dollar against Malaysia Ringgit): 
25 May 2018, Friday, 12.22pm Singapore Time
(Click on Technical Chart above to Expand)

Attached above is the Technicals for SGDMYR foreign exchange pairing -- Singapore Dollar against the Malaysia Ringgit. As more and more revelations are laid transparently by the new government in power, the financial markets may soon realise that it had been pricing in the Malaysia Ringgit wrongly for the past 1 to 2 years over-valuing the Ringgit. The SGDMYR has just broken up the black resistance trend line in SGDMYR Technical Chart 1. There was a yellow symmetrical rounding bottom prior to this break-up in SGDMYR, meaning that the move is with high reliability. The yellow symmetrical rounding for the immediate short term move can hence be projected as on chart. The MYR (Ringgit) will be sold off even more for the SGD in the coming weeks and months. As markets had been pricing in the Ringgit wrongly (over-valuation of MYR), the Ringgit has to regress to the mean as follows in SGDMYR Technical Chart 2:

SGDMYR Chart 2 (Singapore Dollar against Malaysian Ringgit): 
25 May 2018, Friday, 12.22pm Singapore Time
(Click on Technical Chart above to Expand)

This would mean a historical low for the Malaysian Ringgit against the Singapore Dollar never ever seen before. The brown trajectory in SGDMYR Technical Chart 2 is the expected long term trajectory following the short term yellow trajectory in SGDMYR Technical Chart 1. The current standard deviation in the SGDMYR is completing now (as illustrated on chart), and a regression to the mean (significant depreciation of MYR) is taking place now. This will bring the SGDMYR to the 3.3500-3.5500 band in exchange rate in the next 1 to 3 years, with a mean of 2 years. 

Side note:
Malaysia exporters and export-oriented companies whose share prices soared to the sky rapidly in the 2014/2015 sharp MYR-depreciation will soar again. Examples include those of rubber, rubber gloves, etc. Promising ones that will benefit from the great Ringgit depreciation include Top Glove Corporation (KLSE: 7113).

Singapore Straits Times Index: 25 May 2018, Friday, 9.01am Singapore Time

Singapore Straits Times Index:
25 May 2018, Friday, 9.01am Singapore Time
(Click on Technical Charts above to Expand)

Attached is the Technicals for Singapore Straits Times Index (STI). The STI is of the following technical price structure:

Long Term Uptrend
Mid Term Sideways
Short Term Correction

The short term correction is ending soon. Buy on healthy dips. The dips are being used to build supports for the launching of more uptrend. If you are an investor of stocks, index stocks and blue chips, you would be glad to know that the ichimoku red clouds have been weak passing clouds while the green clouds have been strong cumulonimbus green clouds. The long term trend is strong. In addition, because of the technical price structure, shorting of the market presents high risk with low reward compared to buying on dips which will give higher rewards for the lower risk. Bullish.

Thursday, 24 May 2018

Dow Jones Industrial Average (All 30 Component Stocks): 24 May 2018, Thursday, 12.43pm Singapore Time

Dow Jones Industrial Average (All 30 Component Stocks):
24 May 2018, Thursday, 12.43pm Singapore Time
(Click on Technical Charts above to Expand)

Attached are all 30 component stocks of the Dow Jones Industrial Average (DJIA). Out of these 30 component stocks within one of the strongest index in the world -- the DJIA, the top 3 short term strongest trending stocks for buying for the June rally are respectively (highlighted in green on Dow 30 charts) as follows:
1. Intel (NASD: INTC)
2. Nike (NYSE: NKE)
3. Chevron (NYSE: CVX)
The world cup will see these 3 stocks outperform as the strongest ST trending with more upsides. A short term fast gain of at least 5%-10% can be expected for each of them in a swing trading. Bullish (Buy).


Tuesday, 22 May 2018

Sembcorp Marine: 22 May 2018, Tuesday, 4.05pm Singapore Time

Sembcorp Marine: 
22 May 2018, Tuesday, 4.05pm Singapore Time
(Click on Technical Chart above to Expand)

Attached is the Technicals for Sembcorp Marine, a crude oil related cum shipbuilding related stock that is listed in the Singapore SGX. Red circles denote prices being resisted and upmove being rejected. Green circles denote prices being supported and upmove being accepted. Taken together as technical chart interpretation, the entire series of red circled regions and green circled regions show how the stock transits from a long term downtrend into a new bull market of new long term uptrend now. It is ready for more rallies. A rally beyond the high of the entire chart shown is expected.
Reiterate: Highly Bullish (Strong Buy). $2.80 will break up for a move beyond $3.00.


Sugar: 22 May 2018, Tuesday, 12.30am Singapore Time

Sugar: 
22 May 2018, Tuesday, 12.30am Singapore Time
(Click on Technical Chart above to Expand)

Attached above is the technicals for Sugar. The selling is getting dry and sugar is currently at very long term major support (double black trend lines). Sugar has finally arrived at the major support zone of back-testing where risk of longing is low and reward of longing is high, i.e. reward-risk ratio is substantial and rewarding. I am bullish on commodities.

Long term investors may like to look into Sugar ETFs for buying/investing.


Denbury Resources Inc (NYSE: DNR): 22 May 2018, Tuesday, 12.15am Singapore Time


Denbury Resources Inc (NYSE: DNR): 
22 May 2018, Tuesday, 12.15am Singapore Time
(Click on Technical Chart above to Expand)

Attached above is the technicals for Denbury Resources, a crude oil related stock that is listed in the New York Stock Exchange (NYSE: DNR). Someone made more than +100% profits in just 4 months since my 2018-reiteration to buy crude oil related stocks. This is a living example that some of you spot even better sector-momentum stocks than me after I have given the macros direction. This is why I had said that some of you will outperform me if you are diligent enough. Congratulations! I share you joy!


Monday, 21 May 2018

SPDR Gold ETF (NYSE: GLD): 21 May 2018, Monday, 10.37pm Singapore Time

SPDR Gold ETF (NYSE: GLD): 
21 May 2018, Monday, 10.37pm Singapore Time
(Click on Technical Chart above to Expand)

Attached above is the technicals for the SPDR Gold ETF that is listed in the New York Stocks Exchange (NYSE: GLD). The SPDR Gold ETF is pegged almost 1 to 1 with respect to Gold prices. The Gold market has been on a re-accumulation mode. It has been on a hedging mode instead of speculative mode during the consolidation. The black circled regions show confirmations of uptrend. The gold market has been on a bullish ascending triangle of accumulation. The blue circled region is the projected backtest for confirmation of uptrend for gold. Gold remains in a long term uptrend despite mid term and short term corrections. This throws confusion to the markets. The trend remains an uptrend despite short term correction.


Friday, 18 May 2018

Hang Seng Index: 18 May 2018, Friday, 1.15pm Singapore Time

Hang Seng Index: 
18 May 2018, Friday, 1.15pm Singapore Time
(Click on Technical Chart above to Expand)

Attached above is the technicals for Hong Kong Hang Seng Index. 
Refer to the Orange Zone: It shows how the market is illustrating strength after the contraction in supports (S1-S2-S3), resistances (R1-R2-R3) and pivot (P) sandwich.


Thursday, 17 May 2018

iShares MSCI Saudi Arabia Capped ETF (AMEX: KSA): 17 May 2018, Thursday, 12.05pm Singapore Time

iShares MSCI Saudi Arabia Capped ETF (AMEX: KSA): 
17 May 2018, Thursday, 12.05pm Singapore Time
(Click on Technical Chart above to Expand)

Attached above is the Technicals for iShares MSCI Saudi Arabia Capped ETF (AMEX: KSA). The S&P Dow Jones is considering to lift Saudi Arabia to Emerging Market status soon. This is a surest buy before the consideration is established as facts. The target projection is measured by X, representing a significant upside. This is a mid-term uptrend asset class that will continue into a long term uptrend. It is a low risk, high reward and high probability trade. This represents some of the most golden opportunities, in tune with the positive sentiment created by the future IPO listing of Saudi Aramco. 

The Donovan Norfolk Technical Rating:
Highly Bullish

Wednesday, 16 May 2018

Dow Jones Industrial Average: 16 May 2018, Wednesday, 12.15am Singapore Time

Dow Jones Industrial Average: 
16 May 2018, Wednesday, 12.15am Singapore Time
(Click on Technical Chart above to Expand)

Attached above is the Technicals for Dow Jones Industrial Average. It has broken up the extremely large symmetrical triangle of consolidation in black. A large break-up in price structure yields a large price move up. This means DJIA will begin to move beyond the highest high of the triangle. The next target will now be a break-up of 26705.6 points. The next long term target will be 30,000 points for the Dow Jones Industrial Avg Index. DJIA is currently attempting to do a short term backtest at the light green support zone. Once this current back-test of resistances-turned-supports conclude soon, it will brew for a breakout of 26705.6 points. Buy on dips. Markets are very bullish with high upside ahead.


Tuesday, 15 May 2018

DBS Bank Technical Update: 15 May 2018, Tuesday, 2.45pm Singapore Time

DBS Bank Technical Update: 
15 May 2018, Tuesday, 2.45pm Singapore Time
(Click on Technical Chart above to Expand)

Attached above is the Technicals for DBS Bank. DBS Bank is still doing a final back-test of support before we will never the equity price below $30.00 again. The next short term target is $33.26 based on the impulsive thrust of April 2018. This short term target move towards $33.26 is part of a long term move towards $54.32 -- the first real shot at the long term target price. The second long term target price is $100.00.

Past Analyses of DBS Bank
(the most insightful and the most in-depth you can ever get):
http://donovan-ang.blogspot.sg/search/label/DBS

Monday, 14 May 2018

Malaysia KLSE: These 5 Stocks will benefit from new government (Highly Bullish): 14 May 2018, Monday, 9.16am Singapore Time

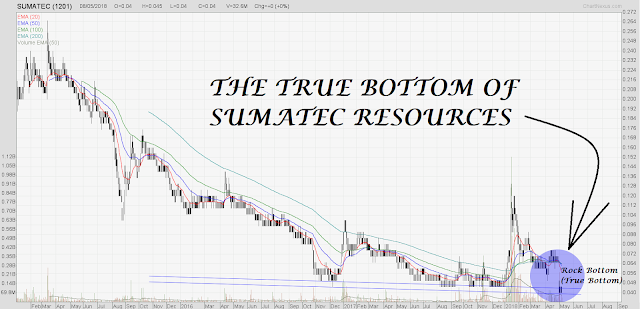
In Malaysia KLSE, these 5 companies will benefit from the new government based on opening volume flow. These will be bullish and go up for the next 1 year with high upsides.
In fact they will make rock bottom this year.

1. SAPURA ENERGY
2. EDEN INC BHD
3. OPCOM HOLDINGS 
4. BERJAYA CORP
5. SUMATEC RESOURCES

SAPURA ENERGY:
14 May 2018, Monday, 9.16am Singapore Time

EDEN INC BHD:
14 May 2018, Monday, 9.16am Singapore Time

OPCOM HOLDINGS:
14 May 2018, Monday, 9.16am Singapore Time

BERJAYA CORP:
14 May 2018, Monday, 9.16am Singapore Time

SUMATEC RESOURCES:
14 May 2018, Monday, 9.16am Singapore Time
(Note: Sumatec is a pn17 stock; do avoid sumatec if one cannot stomach the risk. High risk means high gain for such stocks, but also high loss. This stock is to be played like a warrant: placing in 1k for making 5k or 10k for instance.)

Donovan Norfolk Volume Flow Rating:
High Bullish
(Buy)
THESE 5 STOCKS WILL ROCK BOTTOM (TRUE BOTTOM) IN MAY 2018.


Thursday, 10 May 2018

Diamondback Energy (NASD: FANG): 10 May 2018, Thursday, 9.47pm Singapore Time

Diamondback Energy (NASD: FANG): 
10 May 2018, Thursday, 9.47pm Singapore Time
(Click on Technical Chart above to Expand)

Attached is the updated technicals for Diamondback Energy (NASD: FANG)
Diamondback Energy was the DNA Top Buy list of NYSE-NASDAQ.
Diamondback Energy Overall Analysis as below:
(NASD: FANG)
The Apple of Oil industry
Fundamentals Analysis: bullish
Technical Analysis: bullish
Volume Flow Analysis: bullish

Ascending Triangle of Accumulation is executing a high volume break-up.
This stock will rocket to the sky.
Free money raining from Helicopter-Don.


DBS Bank Technical Update Two: 10 May 2018, Thursday, 10.45pm Singapore Time

DBS Bank Technical Update Two: 
10 May 2018, Thursday, 10.45pm Singapore Time
(Click on Technical Chart above to Expand)

Markets continue to have induced a lot of retailer shorts and retailer sells. 
Markets are flooded with rampant DBS shorts/sells.
A whip on shortists using an abrupt soaring will continue to be brewed nicely. This will be served as a deliciously thick frothy whipped cream. 

The technicals for DBS remain of bullish bias. Real volatility is towards the upside and not downside.
Uptrend strength is intact. More up-moves coming.

Yesterday's DBS Technical Update One as attached below:
http://donovan-ang.blogspot.sg/2018/05/dbs-bank-technical-update-9-may-2018.html

iShares MSCI Malaysia ETF (NYSE: EWM): 10 May 2018, Thursday, 2.25am Singapore Time


iShares MSCI Malaysia ETF (NYSE: EWM) Heavy Plunge: 
10 May 2018, Thursday, 2.25am Singapore Time
(Click on Technical Chart Above to Expand)

The iShares MSCI Malaysia ETF seeks to track the investment results of an index composed of Malaysian equities. It is like an MSCI Index of Malaysia. As of now, Wall Street is reacting and selling the iShares MSCI Malaysia heavily resulting in a heavy crash of 【-9.19%】. The iShares MSCI Malaysia will give an indication of how Malaysian markets will open. As of now, all the major supports are being smashed down (with high volumes) for the Malaysian market. These supports, especially the dark brown classical support, will need to be reclaimed if the Malaysia bull market is to carry on. My take is the broken supports will take time to mend and will eventually be reclaimed back.


Wednesday, 9 May 2018

Crude Oil Weekly, Daily, 4-Hourly and Hourly Chart Concurrent Technical Update: 9 May 2018, Wednesday, 11.00pm Singapore Time

Crude Oil Weekly, Daily, 4-Hourly and Hourly Chart Concurrent Technical Update: 
9 May 2018, Wednesday, 11.00pm Singapore Time
(Click on Technical Chart above to Expand)

Attached above is the Crude Oil Weekly, Daily, 4-Hourly and Hourly Chart Concurrent Live Technical Update. This is how bullish the Crude Oil is, that its technicals on all major timeframes are hyper bullish concurrently. The price actions coupled with ATR and Momentum are very bullish biased. More upmoves coming. My followers' Crude Oil Live Trade Longs (Positional Trades) are now bursting with profits. Congrats to everyone.

DBS Bank Technical Update: 9 May 2018, Wednesday, 2.48pm Singapore Time

DBS Bank Technical Update: 
9 May 2018, Wednesday, 2.48pm Singapore Time
(Click on Technical Chart above to Expand)

Markets have induced a lot of retailer sells and retailer shorts. 
Markets are now flooded with rampant DBS shorts/sells.
A whip on them with a violent soar up will be the whipped cream to be served, deliciously creamy. 

The technicals for DBS remains of strong bullish bias.
Uptrend strength is strong and remains strongly intact.

Additional Intraday Charts as below:
DBS Bank Technical Update: 
9 May 2018, Wednesday, 2.48pm Singapore Time
(Click on Technical Chart above to Expand)

【I'm Rubbing Palms to Kill Short-Sellers: Deliciously Creamy】

Tuesday, 8 May 2018

The REITS Super Sell-off and The Stocks and Cyclicals Super Rally: 8 May 2018, Tuesday, 4.11pm Singapore Time

The REITS Super Sell-off and The Stocks and Cyclicals Super Rally: 
8 May 2018, Tuesday, 4.11pm Singapore Time
(Click on Technical Chart above to Expand)

Attached above is the Technicals for the FTSE ST Real Estate Investment Trusts Index (The REITS Index).  Being extra sensitive to worldwide trends, the FTSE ST indices have traditionally been reliable indicator for worldwide market movement. The red circled region is my live warnings in end-2017 and at the start of 2018 forewarning that REITS will hit inflexion point, start to sell off and go into bear market for this asset class in concern. Everything is enacting per forewarned before prices moved. Refer to past comprehensive explanations taught to you on why REITS would be unwelcomed in rising rates environment. REITS worldwide, especially Singapore, are going to end their correction up soon, and to resume in The Great REITS super plunge. There will be a long-lasting wealth destruction to come for REITS investors in general.

The super crash in REITS (dumping risk-off assets) will also correlate with super rally in risk-on stocks comprising the cyclicals, energy, crude oil, banks, commodities and other risk-on assets such as even mid-cap stocks (embracing risk-on assets).


Olam International: 8 May 2018, Tuesday, 12.10pm Singapore Time

Olam International: 
8 May 2018, Tuesday, 12.10pm Singapore Time
(Click on Technical Chart above to Expand)

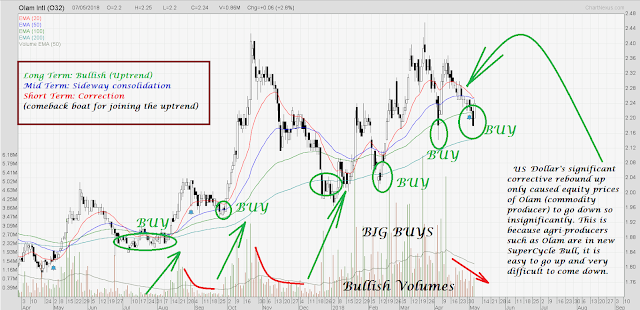
Attached above is the Technicals for Olam International, one of the major soft commodity companies in the world. Olam is being cushioned strongly by the moving average band of supports. The support band has been absorbing all market sells from anyone who wants to sell. This is very bullish in nature. The volume flow so far has been very healthy, suggesting much more upside ahead. The moving average band of supports will be used to launch further uptrends. The technical price structure is as follows:

Long Term: Bullish (Uptrend)
Mid Term: Sideway Consolidation
Short Term: Correction

Additional Note:
USD's significant corrective rebound up only caused equity prices of Olam (commodity producer) to go down very insignificantly. This is because agri-producers such as Olam are in new SuperCycle Bull -- it is easy to go up and very difficult to come down.


Creative Technology: 8 May 2018, Tuesday, 10.45am Singapore Time

Creative Technology: 
8 May 2018, Tuesday, 10.45am Singapore Time
(Click on Technical Chart above to Expand)

Attached above is the Technicals for Creative Technology, the soundblaster company that used to dominate the world but is making a comeback with breakthrough sound technologies that have been patented. If you have been following me for a long time, you will have known that I am a number 1 supporter of anything that is intellectual, high order or high tech. Creative Technology has developed new Intellectual Property (IP), and this is its new fundamentals. Markets are giving endorsement with confirmations after confirmations. The moving average band of supports will be used to launch further uptrends. The volume flow has been extremely good. I would endorse it as Excellent Rating. The projection based on current technical, assuming it does not get negated, yields $13.80 as next target, a multifold multi-bagger gain. The technical price structure for Creative is as follows:

Long Term: Bullish (Uptrend)
Mid Term: Consolidation
Short Term: Consolidation
Immediate Term: Consolidation
Overall: Bullish

Additional Note:
This kind of price structure often tests one's patience, but is a high-rewarding one. If one does not expect to pay patience, then one should not expect oneself to get paid with high rewards of life. 
This is a fundamental Zen Principle of Cause and Effect of Life.