Ticker 1

Ticker 2

Click "Like" to Receive First Hand Updates From The Analysis Site / Click "SHARE" to share

Friday, 29 April 2016

French CAC 40 Index Technical Analysis For Your Learning: 29 April 2016, Friday, 11.00am Singapore Time


French CAC 40 Index Technical Analysis For Your Learning: 
29 April 2016, Friday, 11.00am Singapore Time

Attached above is the French CAC40 Index Technical Analysis.
Refer to previous French CAC40 Index Analysis in January and February 2016 when I said buy on fear and the reasons in Jan and Feb:

I am taking profits of all my France CAC40 Index longs holdings today. Full technicals as illustrated on chart for your learning. This has been an underperforming market in my portfolio, so I am getting rid of this under-performer, with an eye for conducting very short term shorts on this under-performer.

Above are the profits in (E) Euro (EUR).
Below are the profits converted into (SD) Singapore Dollar (SGD).


Profits in this trade:
+ S$ 14,391 SGD

Cumulative:
S$ 894,081 + S$ 14,391
= + S$ 908,472 SGD

Trading Journal:

Thursday, 14 April 2016

NASDAQ-100 Technical Analysis For Your Learning: 14 April 2016, Thursday, 12.35am Singapore Time


NASDAQ-100 Technical Analysis For Your Learning: 
14 April 2016, Thursday, 12.35am Singapore Time

Attached above is the NASDAQ-100 Technical Analysis.
Refer to previous Live NASDAQ Analysis in January 2016 when I said buy on fear and the reasons as to why in Jan-2016:

I am taking profits of the 2nd batch of NASDAQ longs holdings today after previously unloading NASDAQ longs at a loss. Full technicals of this buy and hold trade is as illustrated on chart for your learning of my live trades and my thought processes. Buying on fear together with worldwide smart monies and selling on greed is always lucrative.

Above are the profits in ($) US Dollar (USD).
Below are the profits converted into (SD) Singapore Dollar (SGD).


Profits in this trade:
+ S$ 110,040 SGD

Cumulative:
S$ 784,041 + S$ 110,040
= + S$ 894,081 SGD

Trading Journal:


Wednesday, 13 April 2016

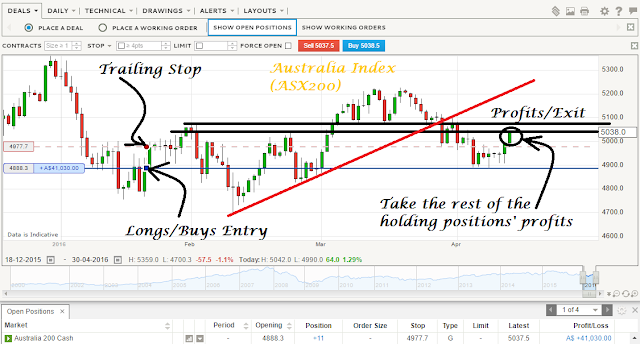
Australian ASX 200 Index Technical Analysis For Your Learning: 13 April 2016, Wednesday, 10.50am Singapore Time


Australian ASX 200 Index Technical Analysis For Your Learning: 
13 April 2016, Wednesday, 10.50am Singapore Time

Attached above is the Australia ASX200 Technical Analysis.

Refer to previous Australian Market Analysis here when I said buy on fear in January 2016:

I am taking profits of the rest of the Aussie market longs holdings today on worldwide bullishness. This is a live trade of how buying on fear and selling on greed is highly lucrative within an optimised minimal timeframe. This is a standard market operation.

I will look for pessimism to set in among the public again before adding some dips.

Above are the profits in (A$) Australian Dollar (AUD).
Below are the profits converted into (SD) Singapore Dollar (SGD).


Profits in this trade:
+ S$ 42,400 SGD

Cumulative:
S$ 741,641 + S$ 42,400
= + S$ 784,041 SGD

Trading Journal:


Tuesday, 12 April 2016

Greece FTSE-ATHEX 20 Index: 12 April 2016, Tuesday, 6.33pm Singapore Time

Greece FTSE-ATHEX 20 Index: 
12 April 2016, Tuesday, 6.33pm Singapore Time

Attached above is the Greece FTSE-ATHEX 20 Index.
Immediate term/Short term correction expected.
Short Greek Stocks Market as above. 
Target Prices as illustrated in Technical Chart.


Australian ASX 200 Index Technical Analysis For Your Learning: 12 April 2016, Tuesday, 4.44pm Singapore Time


Australian ASX 200 Index Technical Analysis For Your Learning: 
12 April 2016, Tuesday, 4.44pm Singapore Time

Attached above is the Australia ASX200 Technical Analysis.

Refer to previous Australian Market Analysis here when I said buy on fear in January 2016:

I am taking profits of partial holdings today (Unload around half of my ASX longs). This is a live trade of how buying on fear and selling on greed is highly lucrative within an optimised minimal timeframe. This is a standard market operation.

I will look for pessimism to set in among the public again before adding some dips.
The above exit was not the best of my trades. However, like soccer, a crappy 1-0 win even when the form is not good is what matters, and is always good enough to win the premier league.

Above are the profits in (A$) Australian Dollar (AUD).
Below are the profits converted into (SD) Singapore Dollar (SGD).


Profits in this trade:
+ S$ 16,268 SGD

Cumulative:
S$ 725,373 + S$ 16,268
= + S$ 741,641 SGD

Trading Journal:


MSCI Singapore (SiMSCI) Technical Analysis For Your Learning: 12 April 2016, Tuesday, 11.30am Singapore Time

MSCI Singapore (SiMSCI) Technical Analysis For Your Learning: 
12 April 2016, Tuesday, 11.30am Singapore Time

Attached above is the MSCI Singpaore (SiMSCI Index) that is akin to trading the Singapore Straits Times Index.

Refer to previous Singapore Market Analysis here when I said buy on fear in January 2016:

I am taking profits of partial holdings today. This is a live trade of how buying on fear and selling on greed is highly lucrative within an optimised minimal timeframe. This is a standard market operation.

However, I will look to add buy on short term dip after May ends to carry on riding the larger rebound.

Above are the profits in (SD) Singapore Dollar (SGD).
Below are the profits in (SD) Singapore Dollar (SGD) after execution of liquidation.


Profits in this trade:
+ S$ 26,730 SGD

Cumulative:
S$ 698,643 + S$ 26,730
= + S$ 725,373 SGD

Trading Journal:

GBPJPY Technical Analysis: 12 April 2016, Tuesday, 10.50am Singapore Time

GBPJPY Technical Analysis: 
12 April 2016, Tuesday, 10.50am Singapore Time

Attached above is the GBPJPY Technicals.
Short GBPJPY
There will be more selling in GBPJPY coming...


Monday, 11 April 2016

Hang Seng Index Technical Analysis For Your Learning: 11 April 2016, Monday, 12.43pm Singapore Time


Hang Seng Index Technical Analysis For Your Learning: 
11 April 2016, Monday, 12.43pm Singapore Time

Attached is the 4-hoourly chart of Hang Seng Index with my technicals, longs entry point, stop-loss point and profit-taking point as shown.

The trade was taken after my live analysis to long/buy the Hang Seng when there was widespread fear in January:
http://donovan-ang.blogspot.sg/2016/01/hang-seng-index-technical-analysis-25.html

The analysis was a buy rating on Hong Kong Market (Hang Seng Index) at 19346.7 points. My buy entry point was 19433.7 points. Taking profits of all my Hang Seng longs today. However, I am still keeping all my NASDAQ and DJIA longs of January.

Above are the profits in (SD) Singapore Dollar (SGD).
Below are the profits in (SD) Singapore Dollar (SGD).


Profits in this trade:
+ S$ 19,930.48 SGD

Cumulative:
S$ 678,713 + S$ 19,930
= + S$ 698,643 SGD

Trading Journal:


Wednesday, 6 April 2016

REX International: 6 April 2016, Wednesday, 10.30am Singapore Time

REX International: 
6 April 2016, Wednesday, 10.30am Singapore Time

Attached above is the weekly chart of REX International that is listed in the SGX.
This stock has high potential as a multifold, multi-bagger stock. 
High profits potential.

1. Capitulation as illustrated and highlighted in technicals above.

2. Big Hands have early set up in this stock, followed by shake-outs and stealth buys in the stock as illustrated in the green circles in the chart above.

3. Current point: at multiple powerful resistance-turned-supports (Brown and Pink technical lines)

4. Break-ups plus a recent absorption of dumping volumes for this stock, with the dumping with fear done by foolish weak-minded retail investors/traders.

5. Based on DNA worldwide Funds Flow Analyses, Smart Monies worldwide continue to be extremely large longs in stocks-equities markets around the world. Rising tide lifts almost all boats. This boat will be lifted.

6. REX International Holding Ltd:
Multi-bagger equates to capital maximization. All other stocks lose their shine in the face of a multi-fold multi-bagger King.

DNA Technical Rating on REX International:
Bullish