Ticker 1

Ticker 2

Click "Like" to Receive First Hand Updates From The Analysis Site / Click "SHARE" to share

Thursday, 28 June 2018

Dow Jones Industrial Average and The Commodity Indices and ETFs (Inter-market Triangulation): 28 June 2018, Thursday, 4.53pm Singapore Time

Dow Jones Industrial Average: 
28 June 2018, Thursday, 4.53pm Singapore Time
(Click on Technical Chart above to Expand)

Attached above is the Technicals for Dow Jones Industrial Average
The DJIA is doing a rounding bottom of re-accumulation. In addition, in case you do not know, in the world of hedge funds, it is common knowledge that if we are in bear market or to go into bear market, during index correction you will not see commodity indices so strong and resilient. If we are to enter into bear market, commodities will had fallen below April 2018 level. Below are 5 commodity charts for inter-market triangulation.

C1: 28 June 2018, Thursday, 4.53pm Singapore Time
(Click on Technical Chart above to Expand)


C2: 28 June 2018, Thursday, 4.53pm Singapore Time
(Click on Technical Chart above to Expand)


C3: 28 June 2018, Thursday, 4.53pm Singapore Time
(Click on Technical Chart above to Expand)


C4: 28 June 2018, Thursday, 4.53pm Singapore Time
(Click on Technical Chart above to Expand)


C5: 28 June 2018, Thursday, 4.53pm Singapore Time
(Click on Technical Chart above to Expand)

Fools are those who buy the story of bear market when US Bull Market is just at the halfway-mark only -- with commodities and crude oil going to take over the next phase of the bull market rally soon.
(90% of the market herd could even know a bear market before it comes, and could even have time to warn one another to get out -- a bear market does not work this way). 


Olam International, Australia ASX All Ord and Commodities: 28 June 2018, Thursday, 9.43am Singapore Time

Olam International: 
28 June 2018, Thursday, 9.43am Singapore Time
(Click on Technical Chart above to Expand)

Attached above is the Technicals for Olam International, one of the major soft commodity companies in the world. Olam is being cushioned strongly by the moving average band of supports and the blue uptrend line support. The supports have been absorbing all market sells from anyone who wants to sell. This is very bullish in nature. The Funds Flow on Olam has been of very positive inflow. The technical price structure is as follows:

Long Term: Bullish (Uptrend)
Mid Term: Consolidation
Short Term: Correction

Additional Note:
USD has to resume big downwave soon. Donald Trump has managed to force Euro and Chinese Yuan to go down with it. China needs a money flood and suppressed interest rates to re-stimulate the Chinese economy now, which means even more Chinese Yuan flood. All these will result in commodities soaring up high. Already, Australia ASX All Ord has been ignoring the "trade war" almost totally.

Australia ASX All Ord:
28 June 2018, Thursday, 9.43am Singapore Time
(Click on Technical Chart above to Expand)

Prepare for commodities and crude oil (including banks) to lead the next large wave up in worldwide bull markets.

Wednesday, 27 June 2018

Multi-Timeframe Technicals of Comfortdelgro: 27 June 2018, Wednesday, 2.25pm Singapore Time

Multi-Timeframe Technicals of Comfortdelgro: 
27 June 2018, Wednesday, 2.25pm Singapore Time
(Click on Technical Chart above to Expand)

Attached is the Technicals for Comfortdelgro, a taxi company in Singapore. After my Monday's precision buy at $2.23 (got at the worst price of Monday), Comfortdelgro is $2.27 now (+1.79% in just 2 days). I am adding one more tranche of buys at $2.27 today. I am extremely bullish, calling this the 3-4 year ROCK BOTTOM and investing more GPMG heavy bullets at this 3-4 year rock bottom.

Development Bank of Singapore (DBS): 27 June 2018, Wednesday, 11.25am Singapore Time

Development Bank of Singapore (DBS): 
27 June 2018, Wednesday, 11.25am Singapore Time
(Click on Technical Chart above to Expand)

Attached is the Updated Technicals for Development Bank of Singapore (DBS), the best bank in Asia-Pacific. Its technical structure is as follows: Long Term Uptrend; Mid Term Uptrend; Short Term Ichimoku Laggard Line backtesting Ichimoku Uptrend Cloud together with Tenkan-Kijun Pair backtesting the Forward Cloud as well (refer to all green circled regions). The volume was not enthusiastic during correction, meaning retail traders were shorting while smart monies were busy loading up at the buy queues using fear. A re-capture of $27.52 will spur a mother of all short squeezes -- people who traded counter-trend against the main uptrend (poor reward-risk ratio: one shall never short against strongest stock of entire SGX). I will put in 3 additional tranche of buys once (1) $27.52 gets taken out upwards (Tranche 1); (2)  $28.79 gets taken out upwards (Tranche 2); (3) $29.47 gets taken out upwards (Tranche 3). 


Tuesday, 26 June 2018

Genting Singapore: 26 June 2018, Tuesday, 4.07pm Singapore Time

Genting Singapore: 
26 June 2018, Tuesday, 4.07pm Singapore Time
(Click on Technical Chart above to Expand)

Attached is the Technicals for Genting Singapore. 
I am adding some more buys on Genting Singapore @ $1.22

Singpost: 26 June 2018, Tuesday , 2.22pm Singapore Time

Singpost: 
26 June 2018, Tuesday , 2.22pm Singapore Time
(Click on Technical Chart above to Expand)

Attached is the Technicals for Singpost, a postal/logistics company listed in the Singapore SGX. The technicals in RED, GREEN and BLUE show you how Singpost has transited stealthily from a long term downtrend to a newfound long term uptrend. It has made use of the fear of "US-China trade war" just to backtest and confirm the newfound bull market (shown by the green circled regions). It would also seem that the correction caused by the "trade war fear" had been used by markets worldwide merely to confirm supports and double confirm long term bull markets, a bullish action that contradicts the 90% herd majority's bearishness. Even the weakest stocks are using trade-war fear to confirm newfound long term uptrends.

Sheng Siong: 26 June 2018, Tuesday, 1.05pm Singapore Time

Sheng Siong:
26 June 2018, Tuesday, 1.05pm Singapore Time
(Click on Technical Chart above to Expand)

Attached is the Technicals for Sheng Siong, a super-mart listed in the Singapore SGX. Sheng Siong's Technical Structure is as follows: Long Term Uptrend; Mid Term Uptrend; Short Term Bull Flag. The Dominant Order Flow and The Net Funds Flow for Sheng Siong continues to be bullish. The Volume Flow and the Technicals for Sheng Siong are bullish too. This means $1.09 will break out upwards. This will spur a $0.20 rally from the $1.09 resistance giving next target of $1.29 -- a more than 29% rally from here.

The Donovan Norfolk Technical Rating:
Very Bullish

Monday, 25 June 2018

FTSE ST Oil and Gas Index: 25 June 2018, Monday, 12.05pm Singapore Time

FTSE ST Oil and Gas Index:
25 June 2018, Monday, 12.05pm Singapore Time
(Click on Technical Chart above to Expand)

Attached is the Technicals for FTSE ST Oil and Gas Index. It is the technicals reflecting the Oil and Gas (O &G Sector) trend. The series of red and green circles illustrate how the Oil and Gas Sector transited stealthily from a long term downtrend to a new long term uptrend. The price structure is large scale, so the upmove brewed will be large in scale. The sector is using current trade war fear to execute a treacherously deep backtest of resistance-turned-support band as illustrated on chart. The next expected upmove is illustrated by the dark brown trajectory. The Orange circled region is where new uptrend had been confirmed in early 2018. The oil and gas sector worldwide has just switched from winter to spring. Worldwide bull market has plenty of legs and plenty of upside. This backtest of supports worldwide is completing soon, and had achieved confirmation by using fear. Outlook: Bullish Bias.

Related Analysis of Today (USD Index):
http://donovan-ang.blogspot.com/2018/06/the-us-dollar-25-june-2018-monday.html

Comfortdelgro: 25 June 2018, Monday, 10.08am Singapore Time

Comfortdelgro: 
25 June 2018, Monday, 10.08am Singapore Time
(Click on Technical Chart above to Expand)

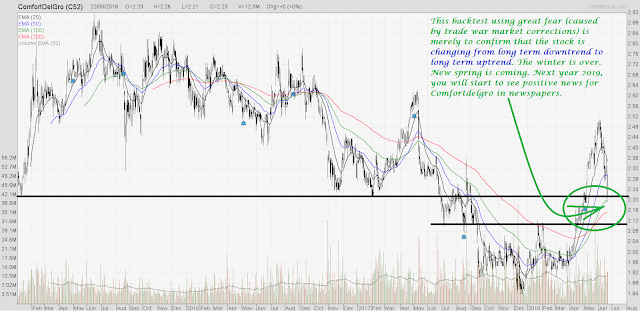
Attached is the Technicals for Comfortdelgro, a taxi company in Singapore. The green circled region is where Comfortdelgro is confirming its newfound bull market (end of its long term downtrend that lasted since 2015). In the green circled region, this backtest using great fear (caused by trade war market corrections) is merely to confirm that the stock is changing from long term downtrend to long term uptrend, and it had been successful based on volume flow. The winter is over. New spring is coming. Next year 2019, you will start to see positive news for Comfortdelgro in the newspapers as market prices in 9 months to 1 year in advance, i.e. starting from May-June this year 2018. I am adding buys on Comfortdelgro @ $2.23.


First Reit: 25 June 2018, Monday, 9.36am Singapore Time

First Reit: 
25 June 2018, Monday, 9.36am Singapore Time
(Click on Technical Chart above to Expand)

Attached is the Technicals for First Reit. The volume flow for First Reit is terrible, ugly and horribly bearish. In line with my bearishness on US Treasury Bonds, USD and Reits and Trusts worldwide for the next 3 years, Reits and Trusts are an asset class to get out. First Reit has refused to bounce off the moving average bands now. While risk-on asset classes, i.e. stocks and equities, prepare to end correction and resume bull market, Reits and Trusts are preparing to super plunge worldwide. I expect First Reit to sell off with high volume and plunge to multi-year lows based on technicals.


Genting Singapore: 25 June 2018, Monday, 9.19am Singapore Time

Genting Singapore: 
25 June 2018, Monday, 9.19am Singapore Time
(Click on Technical Chart above to Expand)

Attached is the Technicals for Genting Singapore, a casino and tourism themed stock. Genting exhibits a bull's flag pole and a bull flag. It is brewing for a spectacular rocket up. Genting will shoot through the roof and create more highs of the entire chart. I am adding more buys on Genting @$1.22 and $1.23. Target price of Genting is way above $1.38. 1st TP: $1.50 for traders. At the end of a bull market, Genting will be way above $2.00 as a reward for investors. I am reiterating my strong bullishness for Genting.


The US Dollar: 25 June 2018, Monday, 12.12am Singapore Time

The US Dollar: 
25 June 2018, Monday, 12.12am Singapore Time
(Click on Technical Chart above to Expand)

Attached is the Long Term Technicals for the US Dollar (USD Index). The entire technical price action flow shows how the USD had made the black support band become the black resistance band in 4Q-2017. In 1H-2018, the USD is making a treacherous backtest of the black support-turned-resistance band to confirm its newfound long term downtrend. The USD is hitting Super-Resistance now (refer chart). It comes at a time when Donald Trump's administration cannot afford to have a strong USD erode the specially crafted Trump policies (trade tariffs, exports, jump-start of Made-in-America, etc.). The Trump administration will have to gear the USD back down soon, otherwise the tariffs will have limited impact and even look silly. This will re-ignite the super-cyclic boom for commodities and commodity stocks worldwide (including crude oil).


Friday, 22 June 2018

Funds Flow Analysis (Dominant Money Flow) DMF of DBS for 22 June 2018

Funds Flow Analysis (Dominant Money Flow) DMF of DBS for 22 June 2018

Dominant Money Flow DMF on DBS for 22 June 2018
= -$16,911,969

DBS Bank Price Action for 22 June 2018
= -0.50%

5-Days' Dominant Money Flow Net Aggregate
-$23,093,132

Thursday, 21 June 2018

NASDAQ 100 INDEX: 21 June 2018, Thursday, 9.30pm Singapore Time


NASDAQ 100 INDEX:
21 June 2018, Thursday, 9.30pm Singapore Time
(Click on Technical Chart above to Expand)

Attached is the Technicals of the US NASDAQ 100 Index. The NASDAQ-100 is being supported at the buy zones as above. Current region remains a buy-on-dip. I am adding some buys on NASDAQ-100 Index. This market is one of the strongest bull market in the world, if not, it is the strongest bull market in the world. Buy the strongest, discard the weakest. I am adding buy on NASDAQ-100 Index on greatest fear, gloom and doom (US-China Trade War).

Funds Flow Analysis (Dominant Money Flow) DMF of DBS for 21 June 2018

Funds Flow Analysis (Dominant Money Flow) DMF of DBS for 21 June 2018

Dominant Money Flow on DBS for 21 June 2018, DMF
= -$22,033,026

DBS Bank Price Action for 21 June 2018
+0.10%

4-Days' DMF Net Aggregate
= -$6,181,163

Wednesday, 20 June 2018

Results of US-China Trade War Round 1: 20 June 2018, Wednesday, 10.43pm Singapore Time

Results of US-China Trade War Round 1:
20 June 2018, Wednesday, 10.43pm Singapore Time
(Click on Technical Chart above to Expand)

As Mr Market is always right and prices in at least 6-9 months ahead of time, the above chart comparison shows the Results of US-China Trade War Round 1: US won in Round 1. If financial markets are an indicator (which always had been), the result shows that the fist of fury drawn out by US' Trump administration bruised China more badly than the fist dealt by China on US. By induction, it can also be concluded that the trade tariffs were delicately planned with deliberate efforts such that the boxer would lose a tooth while the opponent's jaws was dislocated.

Funds Flow Analysis (Dominant Money Flow) DMF of DBS for 20 June 2018

Funds Flow Analysis (Dominant Money Flow) DMF of DBS for 20 June 2018

Dominant Money Flow on DBS for 20 June 2018, DMF
+$2,110,144

DBS Bank Price Action for 20 June 2018
-0.30%

3-Days' DMF Aggregate
+$15,851,863

DBS Bank: 20 June 2018, Wednesday, 1.02pm Singapore Time

DBS Bank: 
20 June 2018, Wednesday, 1.02pm Singapore Time
(Click on Technical Chart above to Expand)

I am adding buys @ $26.99-$27.02


First they ignore you, then they laugh at you, then they fight you, then you win.

Click on Chart above to Expand

<< US-China Trade Relations & Tussle: Which phase are we at now? >>:
Based on the above chart, what do you think? I will leave the imagination to the reader's mind. With reference to the current trade tussle between US and China and the above chart, Mahatma Gandhi's quote immediate comes to mind, going by the trend analysis:
"First they ignore you, then they laugh at you, then they fight you, then you win."

Footnote:
1. When you are agricultural and high population, people ignore you.

3. When you are industrial and manufacturing and high population, people laugh at your made in china goods
5. When you are now 5G, High Tech, Innovative, Creative, Artificial Intelligence and going at the front edge with the back of a high population, people want to fight you.

Alas, you already broke the threshold resistance required for unstoppable momentum.
(High population plus Agricultural, Industrial, Manufacturing, 5G, High Tech, Innovative, Creativity, Artificial Intelligence -- everything you have it now).

Funds Flow Analysis (Dominant Money Flow) DMF of Hutchinson Port Trust (HPH Trust) for 19 June 2018

Funds Flow Analysis (Dominant Money Flow) DMF of Hutchinson Port Trust (HPH Trust) for 19 June 2018

HPH Trust Funds Flow (Dominant Money Flow) for 19 June 2018, DMF
= -$8,927,293

HPH Trust Price Action for 19 June 2018
-3.30%

Past Hutchinson Port Trust Analyses:
https://donovan-ang.blogspot.com/search/label/HPH%20Trust

Tuesday, 19 June 2018

Funds Flow Analysis (Dominant Money Flow) DMF of DBS for 19 June 2018

Funds Flow Analysis (Dominant Money Flow) DMF of DBS for 19 June 2018

DBS Bank Funds Flow (Dominant Money Flow) for 19 June 2018, DMF
= -$1,111,082
(the final half hour today saw heavy selling to flip DMF into red outflow)

DBS Bank Price Action for 19 June 2018
-0.60%

2-Days' DMF Aggregate
= +$13,741,719

Straits Times Index & DBS Bank: 19 June 2018, Tuesday, 2.20pm Singapore Time

Straits Times Index: 
19 June 2018, Tuesday, 2.20pm Singapore Time
(Click on Technical Chart above to Expand)

Attached is even more detailed technical explanations of the Singapore Straits Times Index. The green circled region pointed by the green arrow is the SuperCycle Bull Market confirmation made in 2016 -- using Technical Recession and extreme fear as confirmation of bull market (causing 90% market participants to be wrongly bearish back then and missing out on an almost +200% i.e. 2x move in DBS Bank, my top stock). Markets rallied after that per my precision forewarned rally. 

The Technical Price Structure in Orange is the Cup and Handle formation. It is large and it is bullish. It has broken up the neckline resistance in brown, meaning the markets are brewing for large scale upmove. The purple circled region is the Super-Cycle Bull Market achieving another breakup of resistance, a double confirmation of big bull market, and doing backtest of the brown neckline resistance-turned-support currently -- this time using US-China Trade War and extreme fear as confirmation of bull market (causing 90% market participants to be bearish just like in 2016 back then, meaning DBS Bank, my top stock, will move again another +200% i.e. 2x from here). We are currently in Super-Cycle Super Bull Market despite trade tensions between US and China.