Ticker 1

Ticker 2

Click "Like" to Receive First Hand Updates From The Analysis Site / Click "SHARE" to share

Sunday, 28 February 2016

EURCHF and recent Stock Market Performance: 28 February 2016, 5.00pm Singapore Time

EURCHF and recent Stock Market Performance: 
28 February 2016, 5.00pm Singapore Time

Attached is the advanced T.A of the recent BUMP-AND-RUN technical operation of the EURCHF. The technical aspects of the move are coupled with correlations to the recent stock market performances. Full illustrations as highlighted in chart.

Continued bearishness in EURCHF expected so that continued bullish rebounds in stocks-equities worldwide are still to be expected in the short-mid term.

There are still too many people calling for stock market crashes.
People are getting bearish.
Any stock crash will not happen this year as many Toms, Dicks and Harries are calling for it.
Most of the herd will be in for big surprises this year.

Update:

Someone asked why is EURCHF weakness starting to be able to reflect bullishness in international stocks-equities markets?

Because it indicates the cheap euro that is artificial and man-made is stimulating Eurozone effectively. When Swiss Franc was pegged to Euro previously, this conclusion with respect to stocks-equities markets cannot be made because in the Principles of Economics, cheap Euro could be due to European economic weakness and a pegged Swiss Franc clouds Eurozone performances.

However, after the de-peg of the Swiss Francs with the removal of ceiling, if Euro is cheap and Swiss Francs is strong, it means that the cheap Euro is lifting Eurozone as a whole effectively, which is why Euro remains man-made suppressed, while Swiss Franc subjects to demand-supply of upmove due to Eurozone recovery. This is stimulative for international stock markets.

For those who want to up analysis level, triangulation level and inter-market accuracy, the above is a must read.

Kinder Morgan Inc (NYSE: KMI): 28 February 2016, Sunday, 11.22am Singapore Time

Kinder Morgan Inc (NYSE: KMI):
28 February 2016, Sunday, 11.22am Singapore Time
Chart courtesy of StockCharts.com

Attached above is the technical analysis and volume analysis of Kinder Morgan (KMI) that is listed in the NYSE.

Smart Monies have entered into Kinder Morgan based on volume analysis. The entire process of shake-out, tactical usage of red bearish volumes to buy, pump-up, bullish consolidation and strong buy intentions are all illustrated in depth in the chart above. 

Donovan Norfolk Technical Rating:
Strong Buy for Bear Market Rally in Energy-Oil Stocks
Strong Bullishness


Thursday, 25 February 2016

Golden Agri Technical Analysis: 25 February 2016, Thursday, 2.10pm Singapore Time

Golden Agri Technical Analysis: 
25 February 2016, Thursday, 2.10pm Singapore Time
Chart courtesy of Chartnexus.com

Attached above is the Technical Analysis of Golden Agri Resources, a commodity stock that is listed in Singapore, and is a good litmus as to how worldwide palm oil, palm oil stocks and commodity stocks will perform.

Technical Analysis in Depth: 
1. Selling dried up
2. Buying in heavy volumes took over
3. The entire circled region is where my live Funds Flow Analysis indicated Smart Monies are zero shorts and had been buying commodities and commodity stocks worldwide in preparation for the great commodities rally (commodities bear market rally).
4. Target price is 54.5cents for Golden Agri
5. Fools are those who willingly subject themselves to be brainwashed by international media, and who do not have a mind of their own to decipher from what is right and what is wrong (the herd busy selling, the big monies busy taking the opposite side buying)


Wednesday, 24 February 2016

SUGAR Technical Analysis: 24 February 2016, Wednesday, 11.46pm Singapore Time

SUGAR Technical Analysis: 
24 February 2016, Wednesday, 11.46pm Singapore Time

Attached above is the technical analysis of the impending great sugar rally as well as one of the many examples of the great commodities and commodity stocks' rally that I had forewarned in late-2015 and early-2016 that is to come in 2016. 

As a fellow Big Hand Smart Money, if you sell, I will buy all on offer.

Commodities and Commodity Stocks for 2016:
BULLISH

Dow Jones Industrial Avg (DJIA) Technical Analysis: 24 February 2016, Wednesday, 11.01pm Singapore Time

Dow Jones Industrial Avg (DJIA) Technical Analysis: 
24 February 2016, Wednesday, 11.01pm Singapore Time

Attached above is the technical analysis for the Dow Jones Industrial Avg (DJIA) for the US Markets. All analyses are illustrated as in chart above.

Tuesday, 23 February 2016

GBPAUD Technical Analysis For Your Learning: 23 February 2016, Tuesday, 6.50pm Singapore Time


GBPAUD Technical Analysis For Your Learning: 
23 February 2016, Tuesday, 6.50pm Singapore Time

GBPAUD is still having intensive selling pressure after my previous batches of live shorting trades. Refer to the previous analysis as below:
http://donovan-ang.blogspot.sg/search/label/GBP-AUD

I am taking the 1st batch of shorts profits on GBPAUD today on very bearish sentiments.
Short-Sell on Bullishness, Long-Buy on Bearishness.
Go against the herd slowly.

Above are the profits in (A$) Australian Dollar (AUD).
Below are the profits converted into (SD) Singapore Dollar (SGD).


Profits in this trade:
+ S$ 69,638 SGD

Cumulative:
S$ 337,581 + S$ 69,638
= + S$ 407,219 SGD

Trading Journal:


Friday, 19 February 2016

Gold Technical Analysis: 19 February 2016, Friday, 10.20pm Singapore Time

Gold Technical Analysis: 
19 February 2016, Friday, 10.20pm Singapore Time

Attached above is the Gold asset class analysis as well as the Gold forewarnings with respect to the stocks and equities asset class forewarnings which I had reiterated from 2013-2016. 
The market is enacting all that i had forewarned as well as why and how Gold and Gold ETF investors (who held gold instead of stocks) emerge as greatest winners, an entire process of financial operations which I had said every day from 2013-2015.

It is an important read for those who want to learn from their investment mistakes in the financial markets.


Thursday, 18 February 2016

Wilmar Technical Analysis: 18 February 2016, Thursday, 3.51pm Singapore Time

Wilmar Technical Analysis: 
18 February 2016, Thursday, 3.51pm Singapore Time

Attached above is the technical analysis of Wilmar, a Singapore listed palm oil company.
It is a typical representation of how palm oil, palm oil companies and commodities may execute a larger-wave dead cat bounce yet still be entrenched within a very long term bear market.

Such moves typically make stock buyers excited thinking of bull market. It is meant to add noise to the market since most people do not know what is going on in the market and are easily distorted by less macroscopic moves.


GBPCAD Technical Analysis For Your Learning: 18 February 2016, Thursday, 11.48am Singapore Time


GBPCAD Technical Analysis For Your Learning: 
18 February 2016, Thursday, 11.48am Singapore Time

GBPCAD is having intensive selling pressure as per expected after my re-establishment of bearish technical rating made on it on 22 January 2016. Refer to the previous analysis as below:
http://donovan-ang.blogspot.sg/2016/01/gbpcad-technical-analysis-22-january.html

I am taking the 1st batch of shorts profits on GBPCAD today.
This snowballed money is to be used for further snowballing in either crude oil or precious metals or short term investment in strong bank stocks or commodity stocks.

Above are the profits in (CD) Canadian Dollar (CD).
Below are the profits converted into (SD) Singapore Dollar (SGD).


Profits in this trade:
+ S$ 53,916 SGD

Cumulative:
S$ 283,665 + S$ 53,916
= + S$ 337,581 SGD

Trading Journal:


EURUSD Technical Analysis For Your Learning: 18 February 2016, Thursday, 11.10am Singapore Time


EURUSD Technical Analysis For Your Learning: 
18 February 2016, Thursday, 11.10am Singapore Time

EURUSD is having some selling pressure upon hitting price satisfaction after my longs/bullishness analysis: http://donovan-ang.blogspot.sg/2016/01/eurusd-technical-analysis-27-january.html

I am taking the 2nd batch of longs profits on EURUSD today.

Above are the profits in ($) US Dollar (USD).
Below are the profits converted into (SD) Singapore Dollar (SGD).


Profits in this trade:
+ S$ 25,352 SGD

Cumulative:
S$ 258,313 + S$ 25,352
= + S$ 283,665 SGD

Trading Journal:


Wednesday, 17 February 2016

Light Crude Oil Technical-Volume Analysis: 17 February 2016, Wednesday, 6.30pm Singapore Time

Light Crude Oil Technical-Volume Analysis: 
17 February 2016, Wednesday, 6.30pm Singapore Time

Attached above is the technical-volume analysis of Light Crude Oil (WTI Oil).
High volume brings about price rise and high volume fails to bring about price fall as illustrated in the 2 points in the attached chart: a brewing of major crude oil rebound by the smart monies is at work now.

Crude oil has already found a rock bottom.
This is the true bottom in all Crude Oil Markets and, henceforth, Crude Oil Stocks worldwide will be forming a true bottom in 2016 as well.

:: Related ::
Brent Crude Oil Analysis:

Funds Flow Analysis (FFA): 17 February 2016, Wednesday, 6.15pm Singapore Time


Current Latest Computed Funds Flow Analysis (FFA):
For Worldwide Financial Markets:
17 February 2016, Wednesday, 6.15pm Singapore Time
Donovan Norfolk Ang Funds Flow Analysis Indicator 
for Worldwide Financial Markets 
17 February 2016, Wednesday

Broad Markets / Big Markets / Big Wind Directions

US markets (DJIA. S&P500 and NASDAQ) are 04 hours 15 minutes away from opening for trading while European markets are in the first 02 hours 15 minutes of trading.

Based on current latest computational results, Holdings Index Strength of Big Monies have changed from +10.000 (Maximum Strength Longs) to +10.000 (Maximum Strength Longs) in strength on the Donovan Norfolk Funds Flow Index OscillatorOn the other front, Smart Monies' bullish calls on hand changed to +3.534 in strength on the Donovan Norfolk Funds Flow Index Oscillator.  

Big Money Aggregated Strength (posture) in holdings changed from +4.947 to +6.767  in strength (Smart Monies are Strong Strength Longs in Aggregated Holdings Currently)

Broad Market (Big Wind Direction) Short-Term / Mid-Term Posture by Big Hands:

In the financial markets worldwide:

+ Worldwide Smart Monies maintain MAXIMUM LONGS STRENGTH IN HOLDINGS irregardless of market volatility in any direction
+ Taking consideration of worldwide money flows, Smart Monies will be using all major rebounds to create confirmation of major long term inflexion points.
+ There will be plenty of volatility worldwide because major rebounds are used for technical confirmations of long term inflexion (turning) points.

Worldwide financial markets are executing the following basic technical structures:

Long termLast wave up for US markets; Bear Markets for Asia & Europe
Mid term Rebound
Short term: Volatility

The order of how individual stocks will transit into their individual bear markets respectively

While Long Term Major Top starts to form in indices worldwide, the following is the order of how individual stocks will transit into their individual bear market respectively:

1. Weakest stocks (2.27% of the entire broad market) will start to transit into their bear markets in 2012, making it 2.27% of the entire broad markets in bear market (market indices to still make highs). 

2. Weaker stocks (the next 13.59% of the broad market) will start to transit into their bear markets in 2013, making it 2.27%+13.59%=15.86% of the entire broad markets in bear market (market indices to still make new highs but with deceleration). 

3. Weak stocks (the next 34.13% of the broad market) will start to transit into their bear markets in 2014, making it 15.86%+34.13%=49.99% of the entire broad markets in bear market (market indices to consolidate and to peak out)

4. Strong stocks (the next 34.13% of the broad market) will start to transit into their bear markets in 2015, making it 49.99%+34.13%=84.12% of the entire broad markets in bear market (market indices to start to go downtrend)

5. The stronger and the strongest stocks (the remaining 15.88% of the broad market) will transit into their bear markets in 2016 onwards, making it 84.12%+15.88%=100% of the entire broad markets in bear market (market indices in bear market).

-----------------------------------------------------------------------------------------------------------------
Donovan Big Money Funds Flow Computational Oscillator
-----------------------------------------------------------------------------------------------------------------

Donovan's Funds Flow Analysis Index Oscillator:
-10 ----- 0 ------+10
Donovan's Funds Flow Analysis Strength-Index Scale Key:
negative (-ve) = shorting;
positive (+ve) = longing;
0.000-0.999: Neutral / Negligible Net Holdings
1.000-2.999: Weak strength / weak holdings
3.000-4.999: Moderate strength / moderate holdings
5.000-6.999: Strong strength / high holdings
7.000-8.999:Very strong strength / very high holdings
9.000-10.000:: Maximum strength / maximum holdings

Implication of Broad Markets/Big Markets/Big Wind Indices Directions
If it is a rising tide in Index Big Wind, most or almost all stock boats generally rise;
If it is a receding tide in Index Big Wind, most or almost all stock boats generally go lower.
Hence the importance of Big Wind Directions blown by Big Hands.


Click "Share" on the Facebook icon at the bottom of this thread if you like it, or 
if you would like to start a discussion about it with friends on your Facebook Wall.

Tuesday, 16 February 2016

Gold Technical Analysis: 16 February 2016, Tuesday, 2.37pm Singapore Time

Gold Technical Analysis: 
16 February 2016, Tuesday, 2.37pm Singapore Time

Smart Monies are loading up heavy amount of Gold as reiterated and have finished with their long term re-accumulation of Gold.

Gold is preparing for more rallies to $1550-$1600.
Commodities' dead cat bounce super rally is in the brewing.
Invest in Gold and Gold GLD ETFs; not stocks and equities.

Donovan Norfolk Technical Rating:
BULLISH on Gold and all Gold ETFs (SPDR Gold and Gold GLD ETFs)
Gold will continue to rally with power with a high upside to $1550-$1600.

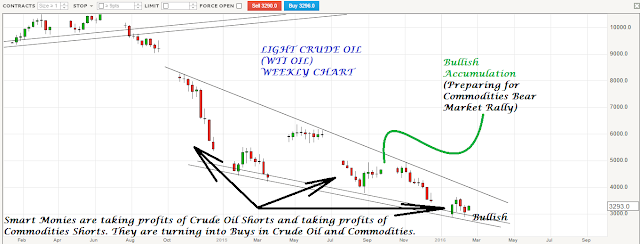
US Light Crude Oil Technical Analysis: 16 February 2016, Tuesday, 10.42am Singapore Time

US Light Crude Oil Technical Analysis: 
16 February 2016, Tuesday, 10.42am Singapore Time

Smart monies are taking profits of crude oil shorts and taking profits of commodities shorts. 
They are turning into buys in crude oil and buys in commodities.
There is bullish re-accumulation going on and there are preparing for commodities' Bear Market Rally. Big Dead Cat Bounce in commodities is in the brewing.

Commodity stocks across the board will benefit from the Bear Market Rally in Commodities.

NZDCHF Technical Analysis For Your Learning: 16 February 2016, Tuesday, 10.21am Singapore Time


NZDCHF Technical Analysis For Your Learning: 
16 February 2016, Tuesday, 10.21am Singapore Time

This is a follow up of my NZDCHF analysis made previously:

Large profits turned into small profits, and there seems to exist some unexpected strength.
I am taking all profits and exiting positions.

Above are the profits in (SF) Swiss Francs (CHF).
Below are the profits converted into (SD) Singapore Dollar (SGD).


Profits in this trade:
+ S$ 4,668 SGD

Cumulative:
S$ 253,645 + S$ 4,668
= + S$ 258,313 SGD

Trading Journal:


Friday, 12 February 2016

France CAC40 Index Technical Analysis: 12 February 2016, Friday, 5.26pm Singapore Time

France CAC40 Index Technical Analysis: 
12 February 2016, Friday, 5.26pm Singapore Time

Attached above is the weekly chart of the France CAC40 Index.
Europe are in the midst of testing critical supports, while Asia has already broken down critical supports.

Worldwide markets are expected to have a critical escape wave rebound in 1H2016, and the above dark brown arrow shows how the French markets may execute its shoulder head shoulder last escape wave before the bear market takes over.

Asian Markets: 
Bear Market, awaiting bear market escape wave rally (Bear Market Rally/Final Escape Wave)

European Markets
In transition for final re-distribution (Rebound for Last Phase Re-Distribution)

US Markets: 
final phase of bull market (Last Wave Up to End Bull Market)


Thursday, 11 February 2016

NASDAQ-100 Technical Analysis For Your Learning of My Mistake: 11 February 2016, Thursday, 2.15pm Singapore Time

NASDAQ-100 Technical Analysis For Your Learning of My Mistake: 
11 February 2016, Thursday, 2.15pm Singapore Time

This is a follow up of my longs previously on 16 Jan 2016:

Attached above is the 4-Hourly Chart for NASDAQ 100 Index as well as my longs entry, stops placed and exit point. The positions in large contracts turned from heavy wins into heavy losses in just one sudden flip, and I am choosing to exit to preserve trading portfolio capital. It is a tough decision, since Funds Flow Analysis worldwide is still a no-shorts. Exiting positions with losses, -US$54,351 USD, from NASDAQ-100 Longs as part of risk management approach. Painful but adopting disciplined risk management since in the 4-hourly chart, selling is more impulsive than any rebound.

Above are the losses in ($) US Dollar (USD).
Below are the losses converted into (SD) Singapore Dollar (SGD).


Losses in this trade:
-S$ 77,065 SGD
(-US$ 54,351 USD)

Cumulative:
S$ 330,710 - S$ 77,065
= + S$ 253,645 SGD

Trading Journal:


Click "Share" on the Facebook icon at the bottom of this thread if you like it, or 


if you would like to start a discussion about it with friends on your Facebook Wall.

Wednesday, 10 February 2016

Hang Seng Index Technical Analysis For Your Learning: 10 February 2016, Wednesday, 11.01am Singapore Time


Hang Seng Index Technical Analysis For Your Learning: 
10 February 2016, Wednesday, 11.01am Singapore Time

Attached above is the Daily Chart for Hang Seng Index as well as my longs entry, stops placed and exit point. Exiting partial positions with losses, -HK$100,222.50 on Hong Kong Hang Seng Longs as part of risk management.


Above are the losses in ($HK) Hong Kong Dollar (HKD).
Below are the losses converted into (SD) Singapore Dollar (SGD).


Losses in this trade:
-S$ 18,162 SGD

Cumulative:
S$ 348,872 - S$ 18,162
= + S$ 330,710 SGD

Trading Journal:


Click "Share" on the Facebook icon at the bottom of this thread if you like it, or 
if you would like to start a discussion about it with friends on your Facebook Wall.

Friday, 5 February 2016

EURUSD Technical Analysis For Your Learning: 5 February 2016, Friday, 12.55am Singapore Time


EURUSD Technical Analysis For Your Learning: 
5 February 2016, Friday, 12.55am Singapore Time

On 27th January 2016, I warned that EURUSD will flip from bearishness to high bullishness, with a Reverse Shoulder-Head-Shoulder in place as follows: http://donovan-ang.blogspot.sg/2016/01/eurusd-technical-analysis-27-january.html

Attached above is the 4-Hourly Chart for EURUSD as well as my longs entry, stops placed and exit point after my analysis of bullishness on EURUSD on 27th Jan 2016:
http://donovan-ang.blogspot.sg/2016/01/eurusd-technical-analysis-27-january.html

EURUSD has rallied crazily in just a span of a few days following the analysis, which spiked my profits crazily. I am taking profits (1st batch) on major break-ups in EURUSD, making use of the good sentiments on EURUSD right now.

:: Related ::
Previous EURUSD Analysis:
http://donovan-ang.blogspot.sg/2016/01/eurusd-technical-analysis-27-january.html

Above are the profits in ($) US Dollar (USD).
Below are the profits converted into (SD) Singapore Dollar (SGD).


Profits in this trade:
+S$ 131,955 SGD

Cumulative:
S$ 216,917 + S$ 131,955
= + S$ 348,872 SGD

Trading Journal:


Click "Share" on the Facebook icon at the bottom of this thread if you like it, or 
if you would like to start a discussion about it with friends on your Facebook Wall.

Thursday, 4 February 2016

AUDUSD Advanced Technical Analysis: 4 February 2016, Thursday, 5.55pm Singapore Time


AUDUSD Advanced Technical Analysis: 
4 February 2016, Thursday, 5.55pm Singapore Time

Attached above is the weekly chart of AUDUSD. 
For those interested in how a bottom forms, the attached technicals above with full illustrations depict how a bottoming process executes and forms.

Target as highlighted by the orange wave projection in chart.


Click "Share" on the Facebook icon at the bottom of this thread if you like it, or 
if you would like to start a discussion about it with friends on your Facebook Wall.