Wednesday, 27 May 2020

Updated Technicals of Spain IBEX Index: 27 May 2020

Updated Technicals of Spain IBEX Index:
27 May 2020
(Click on the Technical Chart Above to Expand)

Attached is the updated Technicals of Spain IBEX Index representing weakness of Eurozone and worldwide markets. 
Short/sell on Good News.

DISCLAIMER

This analysis site, as well as the analyses in it, is created for the sole purpose of education, discussion, fundamental analysis knowledge sharing, technical analysis knowledge sharing, funds flow analysis knowledge sharing, general skills-knowledge sharing and opinions sharing. The contents of this blog are not to be taken as investment advice or inducement to trade, and I take no responsibility for any gains or losses as a result of reading my analyses, judgements and opinions. In essence, practise due diligence. 

Thursday, 21 May 2020

Comparison of the US Banks 20 May 2020, Wednesday

Comparison of the US Banks
20 May 2020, Wednesday
(Click on the Technical Chart Above to Expand)

Attached is the Technical Comparison of the US Banks. Wells Fargo is the weakest followed by Citigroup. Bank of New York Mellon is the strongest followed by Goldman Sachs. Weakest will often remain weaker in comparison to everyone in their respective trends. There is a reason why they are there.


DISCLAIMER

This analysis site, as well as the analyses in it, is created for the sole purpose of education, discussion, fundamental analysis knowledge sharing, technical analysis knowledge sharing, funds flow analysis knowledge sharing, general skills-knowledge sharing and opinions sharing. The contents of this blog are not to be taken as investment advice or inducement to trade, and I take no responsibility for any gains or losses as a result of reading my analyses, judgements and opinions. In essence, practise due diligence. 

Wednesday, 20 May 2020

Gold 3X ETFs: 20 May 2020, Wednesday

Gold 3X ETFs:
20 May 2020, Wednesday
(Click on the Technical Chart Above to Expand)

Attached is the Technicals of typical Gold 3X ETFs.
The green zone is the massive consolidation which I had preempted and reiterated many times in the past few years that they were smart monies' buys for very massive upwave of Gold to come. The first set of blue circled regions are the close to 300% returns since my buy-analysis for Gold (for aggressive gold bull investors). These people will see their holdings go to 1000% returns when my gold TP comes. The 2nd set of single blue circled region is where bullish gold buyers were rewarded with 150% returns on sharp technical backtest. The entire price structure also serves to remind that Gold ascent from breakout is just the start of a big journey up.
(Click on the Technical Chart for the expanded version)

Bullish

DISCLAIMER

This analysis site, as well as the analyses in it, is created for the sole purpose of education, discussion, fundamental analysis knowledge sharing, technical analysis knowledge sharing, funds flow analysis knowledge sharing, general skills-knowledge sharing and opinions sharing. The contents of this blog are not to be taken as investment advice or inducement to trade, and I take no responsibility for any gains or losses as a result of reading my analyses, judgements and opinions. In essence, practise due diligence. 

Monday, 18 May 2020

Singapore Airlines (SIA): 18 May 2020, Monday


Singapore Airlines (SIA):
18 May 2020, Monday
(Click on the Technical Chart Above to Expand)

Attached is the Technicals of Singapore Airlines (SIA), one of the top airlines in the world.
It gives a possible glimpse to the plight of all airlines in the world -- when the strongest in the world is in a bad state, the weak ones would be far worse. On 4th April 2020, when SIA was at $5.50 I had said that the stock was a straight sell as it was in an immensely high pressure selling zone. It is $3.90 now. However, the worst is not over yet. Based on technical price structure, the TP of the breakdown is $3.25 for consolidation. Consolidation means the market needs to decide at $3.25 if the situation clears from there. If yes, there will be a consolidation breakup for buying; if not, there will be a further consolidation breakdown for more down wave and selling. Conclusion: Blue words stated in T.A chart.

Bearish

DISCLAIMER

This analysis site, as well as the analyses in it, is created for the sole purpose of education, discussion, fundamental analysis knowledge sharing, technical analysis knowledge sharing, funds flow analysis knowledge sharing, general skills-knowledge sharing and opinions sharing. The contents of this blog are not to be taken as investment advice or inducement to trade, and I take no responsibility for any gains or losses as a result of reading my analyses, judgements and opinions. In essence, practise due diligence. 

Thursday, 7 May 2020

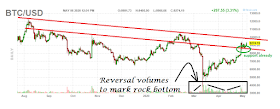
Bitcoins: 7 May 2020, Thursday

Bitcoins:
7 May 2020, Thursday
(Click on the Technical Chart Above to Expand)

Attached is the technicals of Bitcoins. The black boxed region is the volume flow of reversal volumes that mark a rock bottom. Such volume flow at bottoms successfully reverse a flow and create a new major tide 90% of the time. The green circled region is where Bitcoins are finding secret new supports. A breakout of the double red resistance lines will create an a significantly major new tide up. I am ending any bearishness on Bitcoins, and am resuming my bullish outlook on Bitcoins.

DISCLAIMER

This analysis site, as well as the analyses in it, is created for the sole purpose of education, discussion, fundamental analysis knowledge sharing, technical analysis knowledge sharing, funds flow analysis knowledge sharing, general skills-knowledge sharing and opinions sharing. The contents of this blog are not to be taken as investment advice or inducement to trade, and I take no responsibility for any gains or losses as a result of reading my analyses, judgements and opinions. In essence, practise due diligence. 
Sunday, 3 May 2020

CapitaLand Ltd (Top 3 Property Company in Singapore and one of the best in Asia, and an attempted peer into the Property Sector Worldwide): 3 May 2020, Sunday, 10.25pm Singapore Time

CapitaLand Ltd (Top 3 Property Company in Singapore and one of the best in Asia, and an attempted peer into the Property Sector Worldwide):
3 May 2020, Sunday, 10.25pm Singapore Time
(Click on the Technical Chart Above to Expand)

Attached is the Technicals of Capitaland (Top 3 Property Companies in Singapore and one of the best in Asia, and possibly the world as well). As it is one of the best in the world, especially in Asia, it gives an indication as to which phase we are at in the property market secular cycle.

Point 1 and Point 2 in chart coincides with the entire Long Term 10-Year Cycle of an interest rate move. Alas, at the end of the one major down and one major up in the 10-year interest rate cycle, even elite property companies like CapitaLand have made one confirmation now: that the property markets' best days are over. We are at the sunset.

The next TP for CapitaLand is another -71% down to $0.86 in price. This follows standard price structure theory of first impulsive wave down, followed by symmetrical triangular consolidation lasting from 2009 to 2020, and a breakdown now. The breakdown of long term consolidation has been achieved now. The price actions of the property sector, and property stocks, could no longer perform overpar under both low interest rate and recovering higher rates which rose merely slowly from 2009 to 2020 -- an environment extremely conducive for property markets.

For property markets, if there is good high price, there is likely not much liquidity. The fact is that income and employment of the largest middle-class do not match up to the property inflation anymore. We call that a gap. There are just not enough good jobs or high paying jobs to match up to the properties. This is a phenomenon happening worldwide. This is why property stocks could no longer break up previous highs of 2008 no matter how conducive interest rate environments were. 

The financial money game of phony artificially inflated assets is coming to an end worldwide, especially real estate, and especially in Asia, because there is not much greater fools within the greater fools' theory anymore; most greater fools had already been in, and even if fools wanted to play the game, the income and employment conditions (that gap) does not catch up to the game anymore. And despite banks being enabled worldwide to lend out unlimited cheap monies to the masses, the gap between income (and employment) and property prices of the largest middle class can no longer provide the volume to support the asset bloated eco-system.

Nobody, in their wildest dream, will ever believe property markets can keep going down against them. Classical conditioning has been deeply entrenched, and sheeps could be slaughtered. This then is where risk and danger is.


DISCLAIMER

This analysis site, as well as the analyses in it, is created for the sole purpose of education, discussion, fundamental analysis knowledge sharing, technical analysis knowledge sharing, funds flow analysis knowledge sharing, general skills-knowledge sharing and opinions sharing. The contents of this blog are not to be taken as investment advice or inducement to trade, and I take no responsibility for any gains or losses as a result of reading my analyses, judgements and opinions. In essence, practise due diligence.